
📊 MARKET OVERVIEW
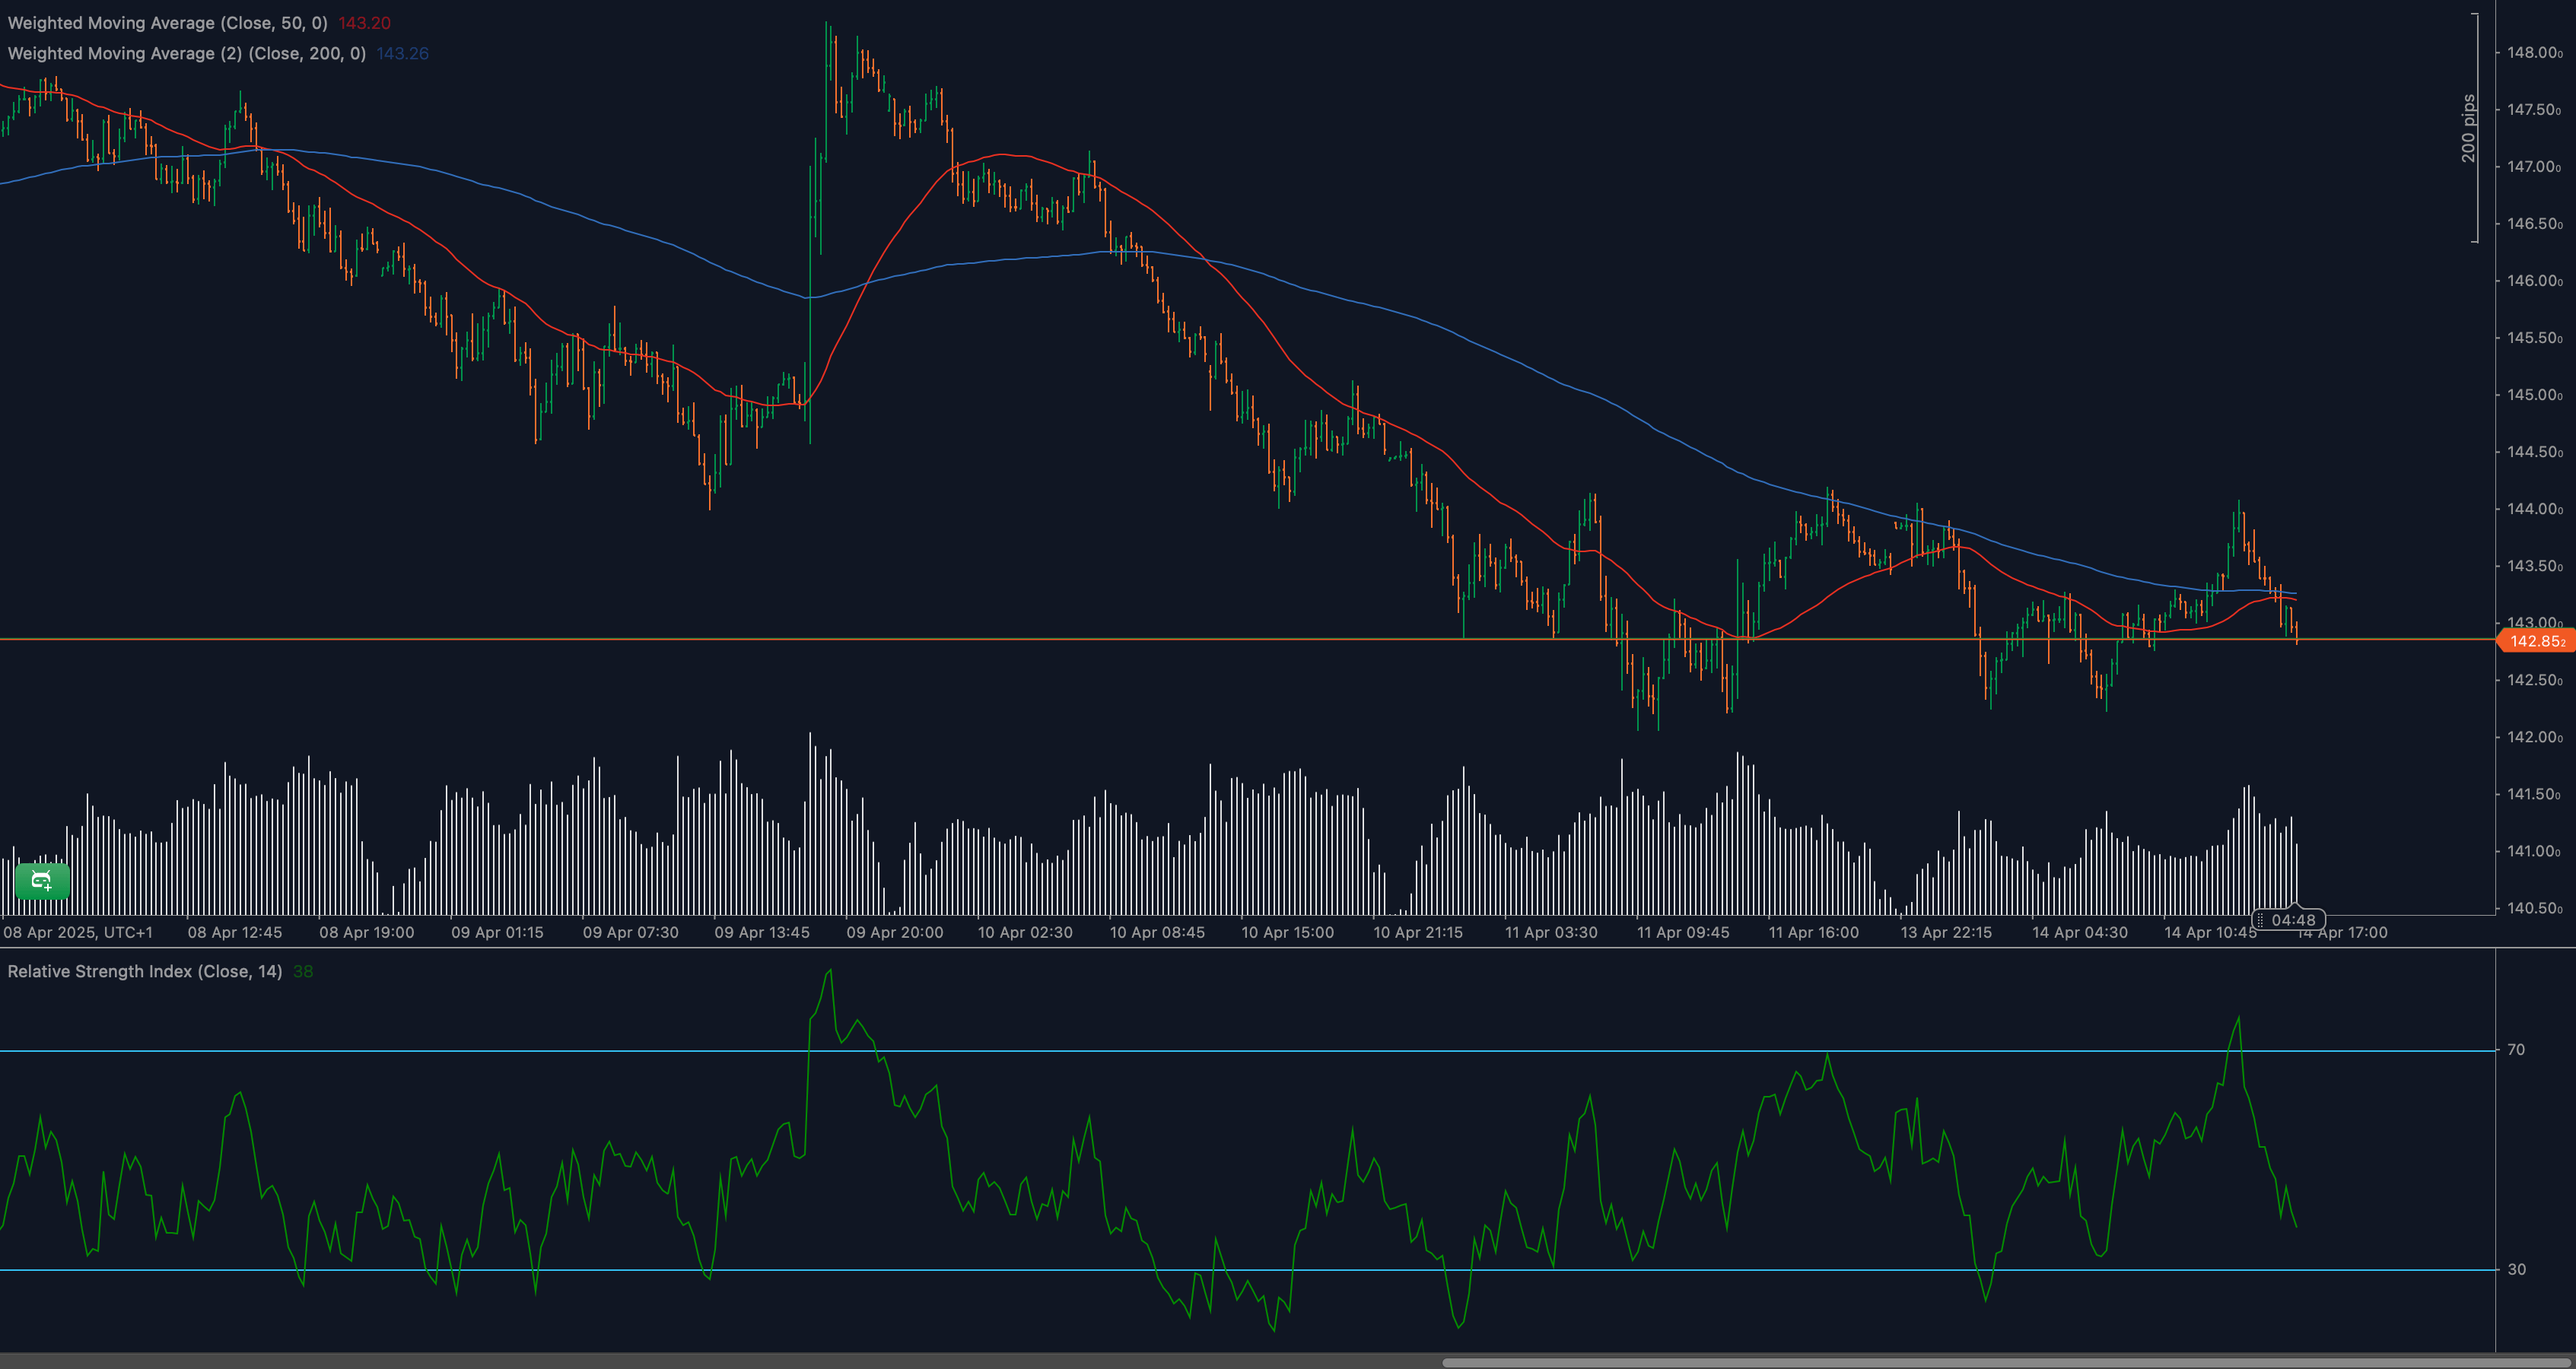
USD/JPY is under renewed bearish pressure as it revisits the critical support level of 142.85. After an early month recovery stalled near the 144.20 zone, sellers have regained control, driving the pair lower and pulling it beneath both short- and long-term moving averages. This level now acts as a pivot point where directional conviction could soon be decided.
The broader market context includes a softer dollar backdrop, fragile risk sentiment, and shifting expectations around Fed policy. All of these contribute to heightened uncertainty, placing additional technical weight on how USD/JPY behaves around this key inflection zone.
📈 TECHNICAL ANALYSIS
What Are the Key Support and Resistance Levels for USD/JPY?
Immediate support is clearly defined at 142.85. This level has held multiple times during the current consolidation, but selling pressure is mounting. If this support breaks, the next targets lie near 141.90 and 140.60. On the upside, key resistance can be found at 143.60 and more significantly at 144.20, where previous bullish momentum was sharply rejected. A break above that level would invalidate the bearish outlook and shift the structure toward a more neutral-to-bullish tone.
Moving Average Analysis and Dynamic Price Levels
Price is now trading below both the 50-period WMA (143.20) and the 200-period WMA (143.26), indicating a bearish tilt across both short- and medium-term trends. The slope of the 50-WMA has begun to turn downward, while the 200-WMA is flattening. These dynamic resistance points could cap any upside attempts unless a strong bullish catalyst re-emerges.
RSI Momentum Analysis and Divergence Patterns
The 14-period RSI is showing consistent signs of momentum fading. After previously forming bearish divergence near 144.20, the indicator has now dropped to around 38, confirming declining bullish strength. This weakening momentum adds confluence to the idea that sellers are taking charge and that a breakdown below 142.85 could accelerate the next leg lower.
Price Action and Candlestick Analysis
Recent candlestick patterns reveal a market leaning bearish. There have been several bearish engulfing candles and rejection wicks near resistance levels. Price action is consolidating tightly above 142.85, but the lack of bullish follow-through on rebounds suggests more distribution than accumulation. This makes the support zone increasingly vulnerable to a clean downside break.
Chart Patterns and Formation Analysis
The broader structure is developing into a descending channel or bearish flag continuation pattern. Lower highs and consistent pressure against horizontal support imply a coiling market preparing for breakout resolution. If sellers can pierce the current base convincingly, the measured move from the pattern suggests a downside projection toward 141.00 or lower.
Fibonacci Retracement Levels and Extension Targets
Using the swing from 139.50 to 144.20, the 38.2% Fibonacci retracement falls precisely at 142.85, adding technical weight to this level. A confirmed breakdown would open the way to the 50% retracement near 141.90, and then the 61.8% at 140.60. Conversely, bullish recovery above 144.20 could reintroduce the 145.50 extension as a viable upward target.
🔍 MARKET OUTLOOK & TRADING SCENARIOS
Bullish Scenario for USD/JPY
For the bullish case to take hold, the pair must rebound decisively from the 142.85 support, reclaim the 50- and 200-WMA, and break through resistance at 144.20. Such a move would invalidate the current bearish structure and set up a potential retest of 145.50, especially if RSI recovers above 50 and price closes strongly above the recent highs.
Neutral Scenario for USD/JPY
If price continues to hover around 142.85 without directional commitment, a range-bound environment between 142.85 and 144.20 could dominate. This would support short-term mean-reversion strategies until momentum or a breakout confirms a new trend. Sideways RSI movement between 45–55 would be a hallmark of this scenario.
Bearish Scenario for USD/JPY
A clean break and close below 142.85 would confirm the continuation of the bearish move, especially if supported by increasing volume and RSI dropping below 35. Such a development opens the door for accelerated downside toward 141.90 and 140.60. Failed retests of 142.85 from below would add further confirmation for bearish entries.
💼 TRADING CONSIDERATIONS
Traders should closely monitor 142.85 for breakout confirmation, as this level is a critical tipping point. A break lower offers strong reward-to-risk potential for short positions targeting the 141.90 and 140.60 areas, especially if accompanied by bearish RSI momentum. Stop-losses for short setups can be considered above 143.60 to allow for normal volatility.
For bullish setups, patience is key. Only a strong reaction off 142.85 with follow-through above the WMAs and 144.20 resistance would justify long entries. Waiting for bullish engulfing candles or strong RSI crossovers above 50 can offer cleaner risk-defined entries in such a scenario.
🏁 CONCLUSION
USD/JPY is in a pivotal position as it tests the crucial 142.85 support level. With bearish RSI momentum and pressure from declining moving averages, the risk of breakdown is rising. However, until a clean break occurs, traders must remain agile and responsive. Price action around this level will likely define the next phase, making risk management and signal confirmation essential.
⚠️ DISCLAIMER
This analysis is intended for informational purposes only and does not constitute financial advice. Trading in leveraged products involves significant risk and may not be suitable for all investors. Always conduct your own research and consult a qualified financial advisor before making trading decisions.


