
📊 MARKET OVERVIEW
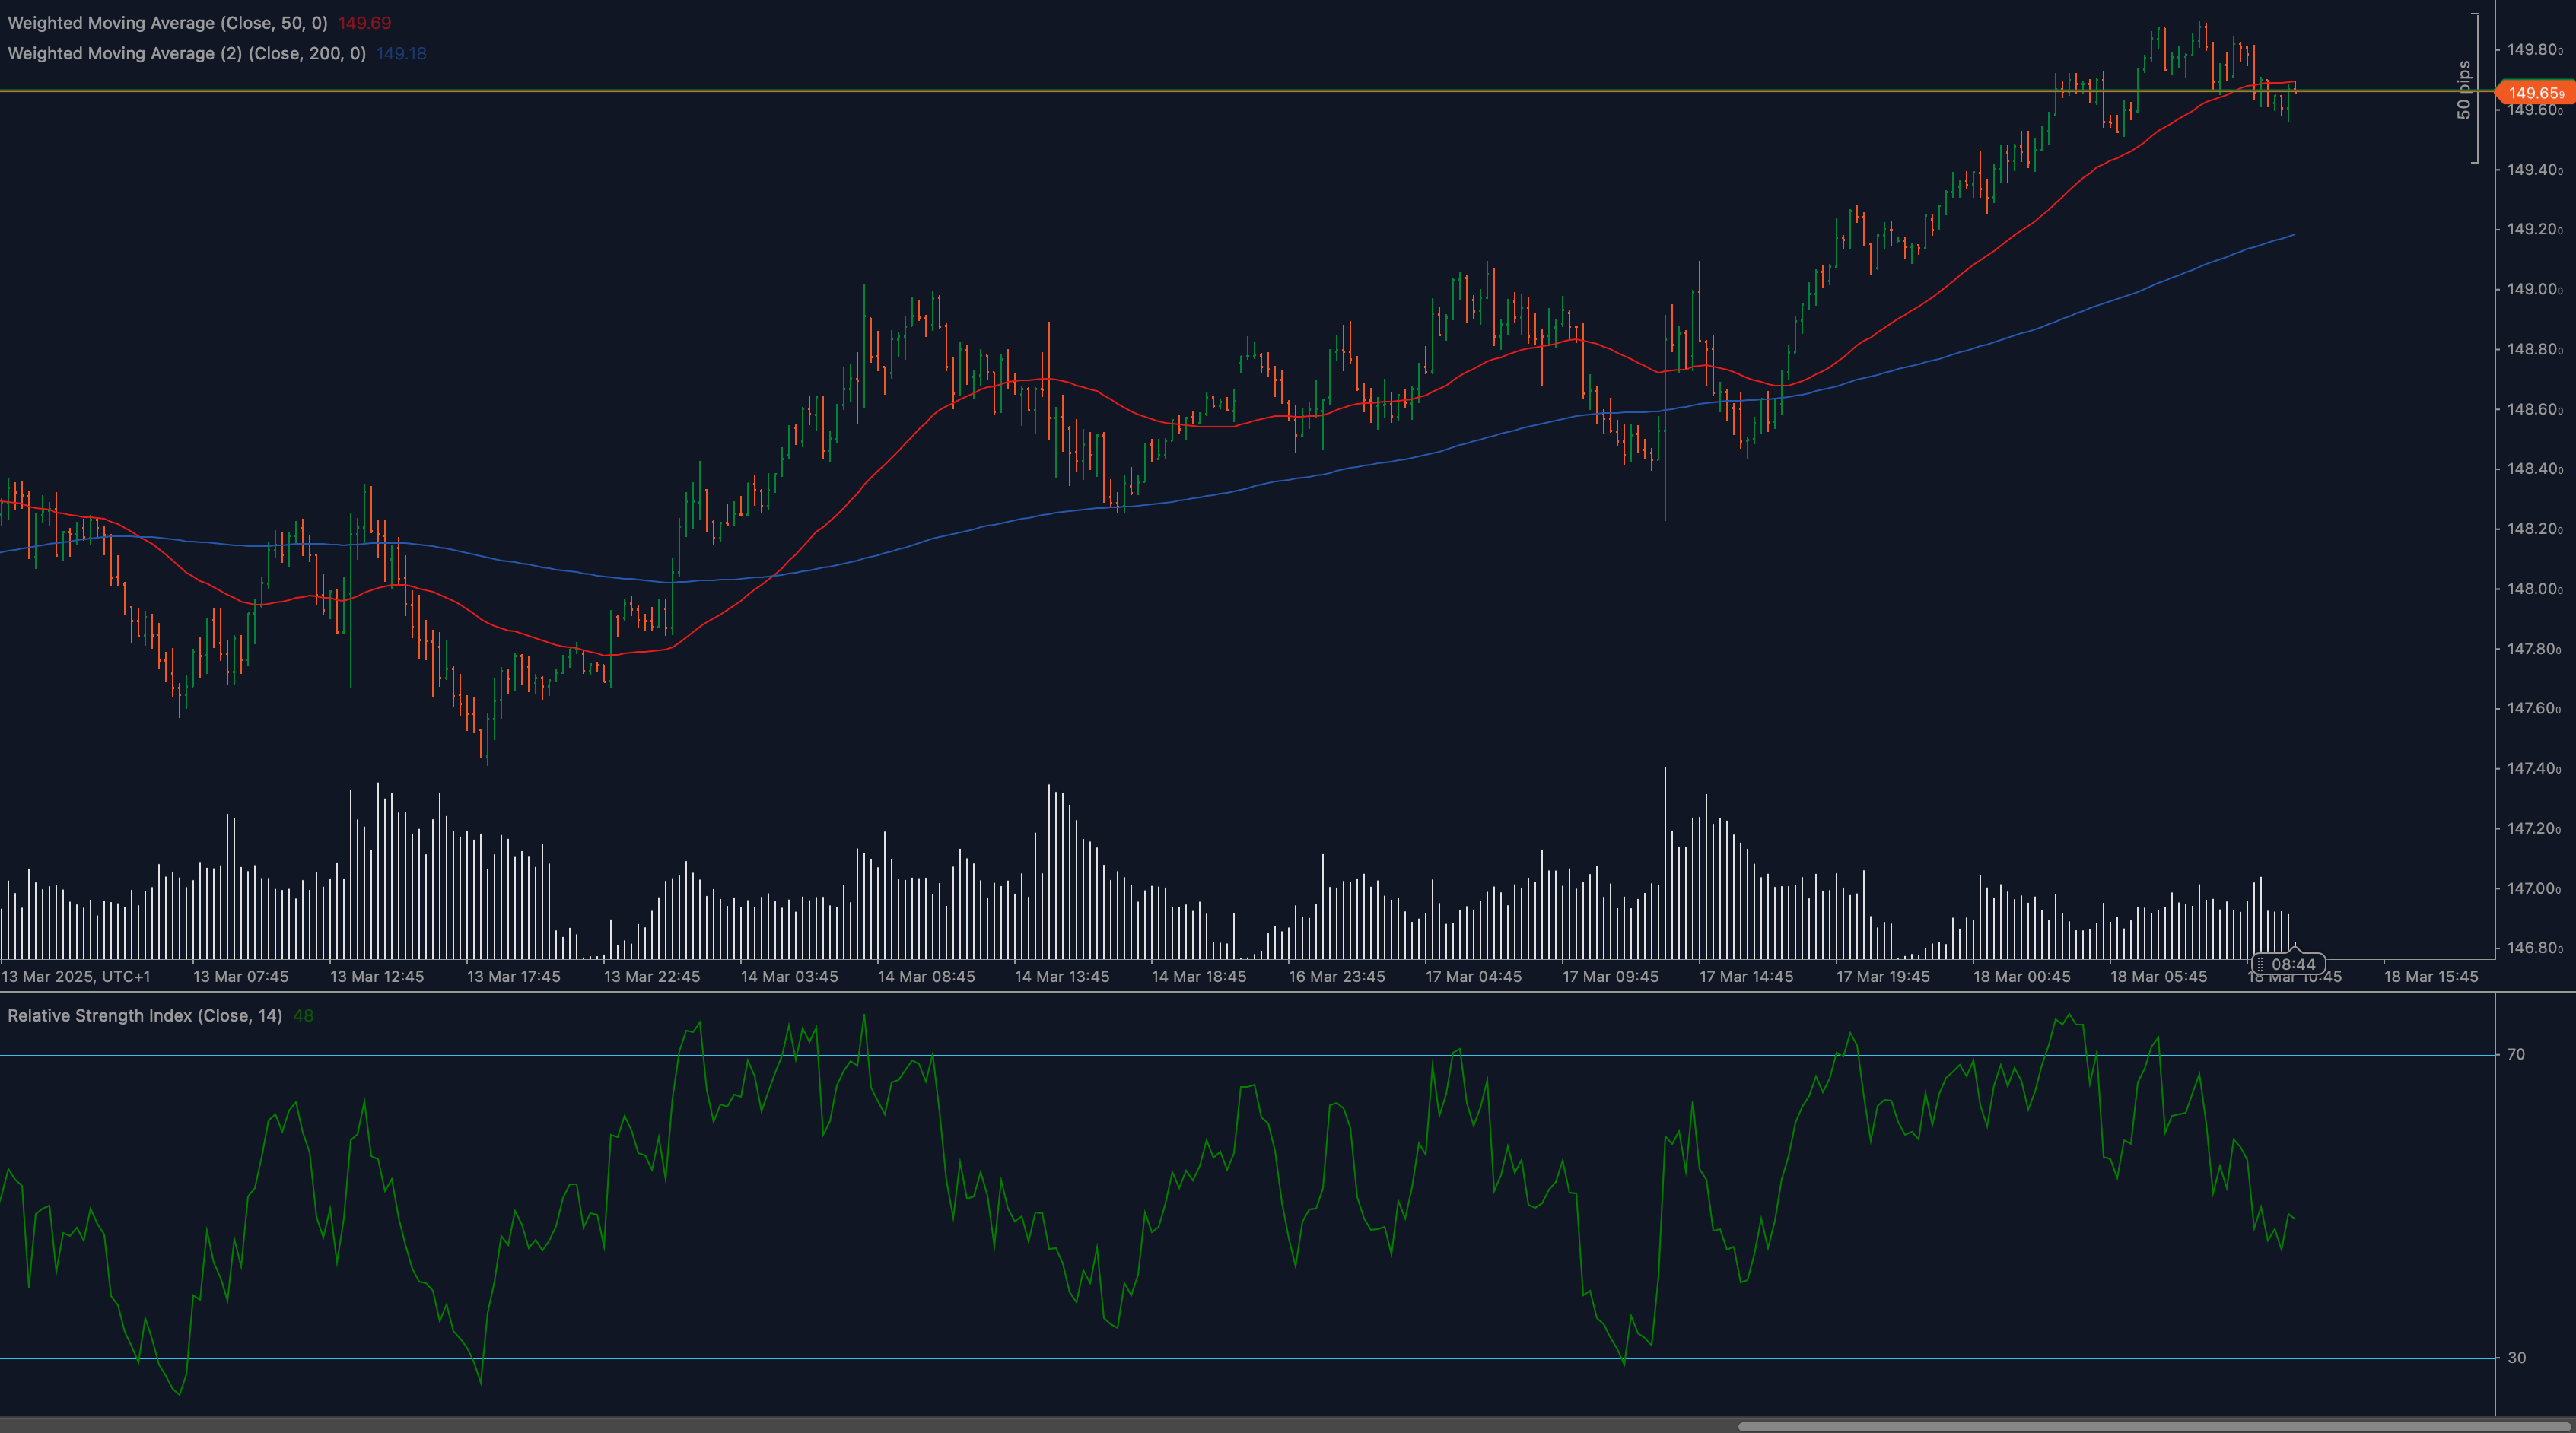
USDJPY has established a solid uptrend structure over the past week, with price action currently testing a significant resistance level at 149.65. Looking at the chart, we can see the pair has been making higher highs and higher lows, with the 50-day moving average (red line) providing dynamic support around the 148.60 zone. The current price action shows consolidation just below the resistance, suggesting traders are evaluating the pair’s ability to break higher, potentially targeting the psychological 150.00 level.
The broader market context shows USDJPY maintaining bullish momentum despite some potential divergence signals in momentum indicators. Volume patterns suggest continued interest from buyers, though some caution is warranted as the pair approaches established resistance zones that have historically triggered interventions from Japanese monetary authorities.
📈 TECHNICAL ANALYSIS
What Are the Key Support and Resistance Levels for USDJPY?
The most immediate resistance level for USDJPY sits at 149.65, which is being tested in the current price action. This level has historical significance and represents a decision point for traders. A clean break above this resistance could open the path toward the psychological 150.00 level, followed by the recent high around 150.80.
On the support side, the 50-day moving average at approximately 148.60 (red line) provides the first dynamic support level. Below this, we have structural support at 148.20, which coincides with recent swing lows. The more significant support comes from the 200-day moving average (blue line) currently positioned around 148.00, which has contained previous corrections and represents the primary trend-defining level.
Moving Average Analysis and Dynamic Price Levels
The 50-day moving average (red line) is trending upward and positioned above the 200-day moving average (blue line), confirming the bullish market structure. Let’s talk about how these moving averages have been interacting with price action: the 50-day MA has consistently provided support during minor pullbacks, suggesting strong underlying bullish momentum.
The price is currently trading above both major moving averages, which is a classic bullish alignment. The increasing distance between the 50-day and 200-day MAs indicates strengthening momentum in the prevailing uptrend. However, extended distances between price and the moving averages often precede consolidation or minor corrections, which traders should monitor.
RSI Momentum Analysis and Divergence Patterns
The Relative Strength Index (RSI) is currently reading at 65, showing strong but not yet overbought momentum. Looking at the RSI patterns, we can observe potential bearish divergence forming, where price has reached higher highs while the RSI has made lower highs. This divergence suggests weakening momentum despite the price advance and could signal an upcoming correction or consolidation phase.
The RSI has been oscillating between the 30-70 range, which indicates normal market conditions without extreme overbought or oversold signals. Previous RSI readings above 70 have coincided with short-term price peaks, which provides context for what might happen if momentum continues to build.
Price Action and Candlestick Analysis
Recent candlestick patterns show a series of small-bodied candles near the resistance level, indicating indecision or struggle to break higher. The presence of several doji-like formations suggests equilibrium between buyers and sellers at this critical juncture. The most recent candle shows a red close, potentially signaling some profit-taking after the rally.
Previous price action shows stronger bullish candles with substantial bodies during the uptrend phase, confirming buyer control during that period. The volume profile supporting these moves appears consistent with the bullish narrative, though diminishing volume during the latest push could indicate waning momentum.
Chart Patterns and Formation Analysis
USDJPY has formed an ascending channel pattern over the past week, with price consistently respecting both the upper and lower boundaries. The current test of resistance coincides with the upper channel boundary, making this a particularly significant level.
We can also identify a potential cup and handle formation on a broader timeframe, with the current consolidation possibly forming the “handle” portion of the pattern. A successful completion of this pattern would target levels above 150.00. Additionally, the series of higher lows forms a clear bullish trendline that provides dynamic support on pullbacks.
Fibonacci Retracement Levels and Extension Targets
From the recent swing low to high, the 38.2% Fibonacci retracement level aligns closely with the 50-day moving average, reinforcing the importance of the 148.60 support zone. The 23.6% retracement at approximately 149.20 may provide intraday support during minor pullbacks.
Looking at Fibonacci extensions, a break above current resistance could target the 127.2% extension level near 150.30, followed by the 161.8% extension at approximately 151.20. These levels provide potential profit targets for traders looking to capitalize on a bullish breakout scenario.
🔍 MARKET OUTLOOK & TRADING SCENARIOS
Bullish Scenario for USDJPY
In the bullish case, USDJPY breaks decisively above the 149.65 resistance with increased volume, targeting the psychological 150.00 level in the near term. A daily close above 150.00 would strengthen the bullish case, potentially extending gains toward 150.80 and even 151.20 at the 161.8% Fibonacci extension.
Supporting factors for this scenario include continued strength in US Treasury yields, hawkish Federal Reserve stance relative to the Bank of Japan, and positive US economic data releases. The 50-day MA would continue providing dynamic support on pullbacks, maintaining the bullish structure intact.
Neutral Scenario for USDJPY
The neutral scenario involves USDJPY consolidating between the 149.65 resistance and 148.60 support (50-day MA), creating a range-bound environment. This would represent a period of equilibrium where the market digests recent gains before deciding on the next directional move.
In this case, traders would benefit from range-trading strategies, buying near support and selling near resistance until a clear breakout occurs. The RSI would likely stabilize in the middle range (40-60), neither confirming nor denying the underlying bullish bias.
Bearish Scenario for USDJPY
If USDJPY fails at the 149.65 resistance and breaks below the 50-day MA support at 148.60, this would trigger a bearish scenario. Initial targets would be the 200-day MA around 148.00, followed by the recent swing low at 147.40.
Catalysts for this scenario might include Japanese government intervention concerns as the pair approaches 150.00, dovish shifts in Fed policy expectations, or risk-off market sentiment driving flows into the Japanese yen as a safe-haven currency. The bearish case would be confirmed by a break below the ascending trendline and the 200-day moving average.
💼 TRADING CONSIDERATIONS
When trading USDJPY at current levels, risk management becomes particularly crucial given the pair’s proximity to significant resistance and potential intervention zones. Consider placing stop-loss orders below the 50-day MA for long positions or above the recent swing high for short positions.
Position sizing should reflect the increased volatility typically seen when USDJPY approaches the 150.00 threshold, which has historically attracted attention from Japanese monetary authorities. Breaking down entries into multiple lots can help manage this risk while still maintaining exposure to potential breakouts.
For day traders, intraday support and resistance levels can be identified using the recent price action, with 149.40 and 149.20 serving as interim support levels, while 149.65 and 150.00 provide near-term resistance. Range-bound strategies may prove effective until a clear breakout materializes.
Longer-term traders should monitor fundamental catalysts including the interest rate differential between the US and Japan, which continues to favor dollar strength. However, be aware that extreme positioning in USDJPY often precedes sharp corrections, especially when approaching levels that may trigger policy responses.
🏁 CONCLUSION
USDJPY is at a critical technical juncture, testing the significant 149.65 resistance level with mixed momentum signals. The underlying trend remains bullish, supported by the positive alignment of key moving averages and the series of higher lows. However, the potential RSI divergence and proximity to levels that have historically attracted intervention warrant caution.
Traders should adopt a strategic approach, preparing for multiple scenarios including a bullish breakout toward 150.00+, a period of consolidation between key levels, or a corrective move targeting the 50-day and 200-day moving averages. As always with USDJPY, remaining aware of fundamental drivers and potential policy interventions remains crucial for successful trading.
⚠️ DISCLAIMER
This analysis is provided for informational purposes only and does not constitute investment advice. Trading foreign exchange carries significant risk and may not be suitable for all investors. Past performance is not indicative of future results. Always conduct your own research and consider your financial situation before making any trading decisions. The author and publisher are not responsible for any losses incurred based on this analysis.


