
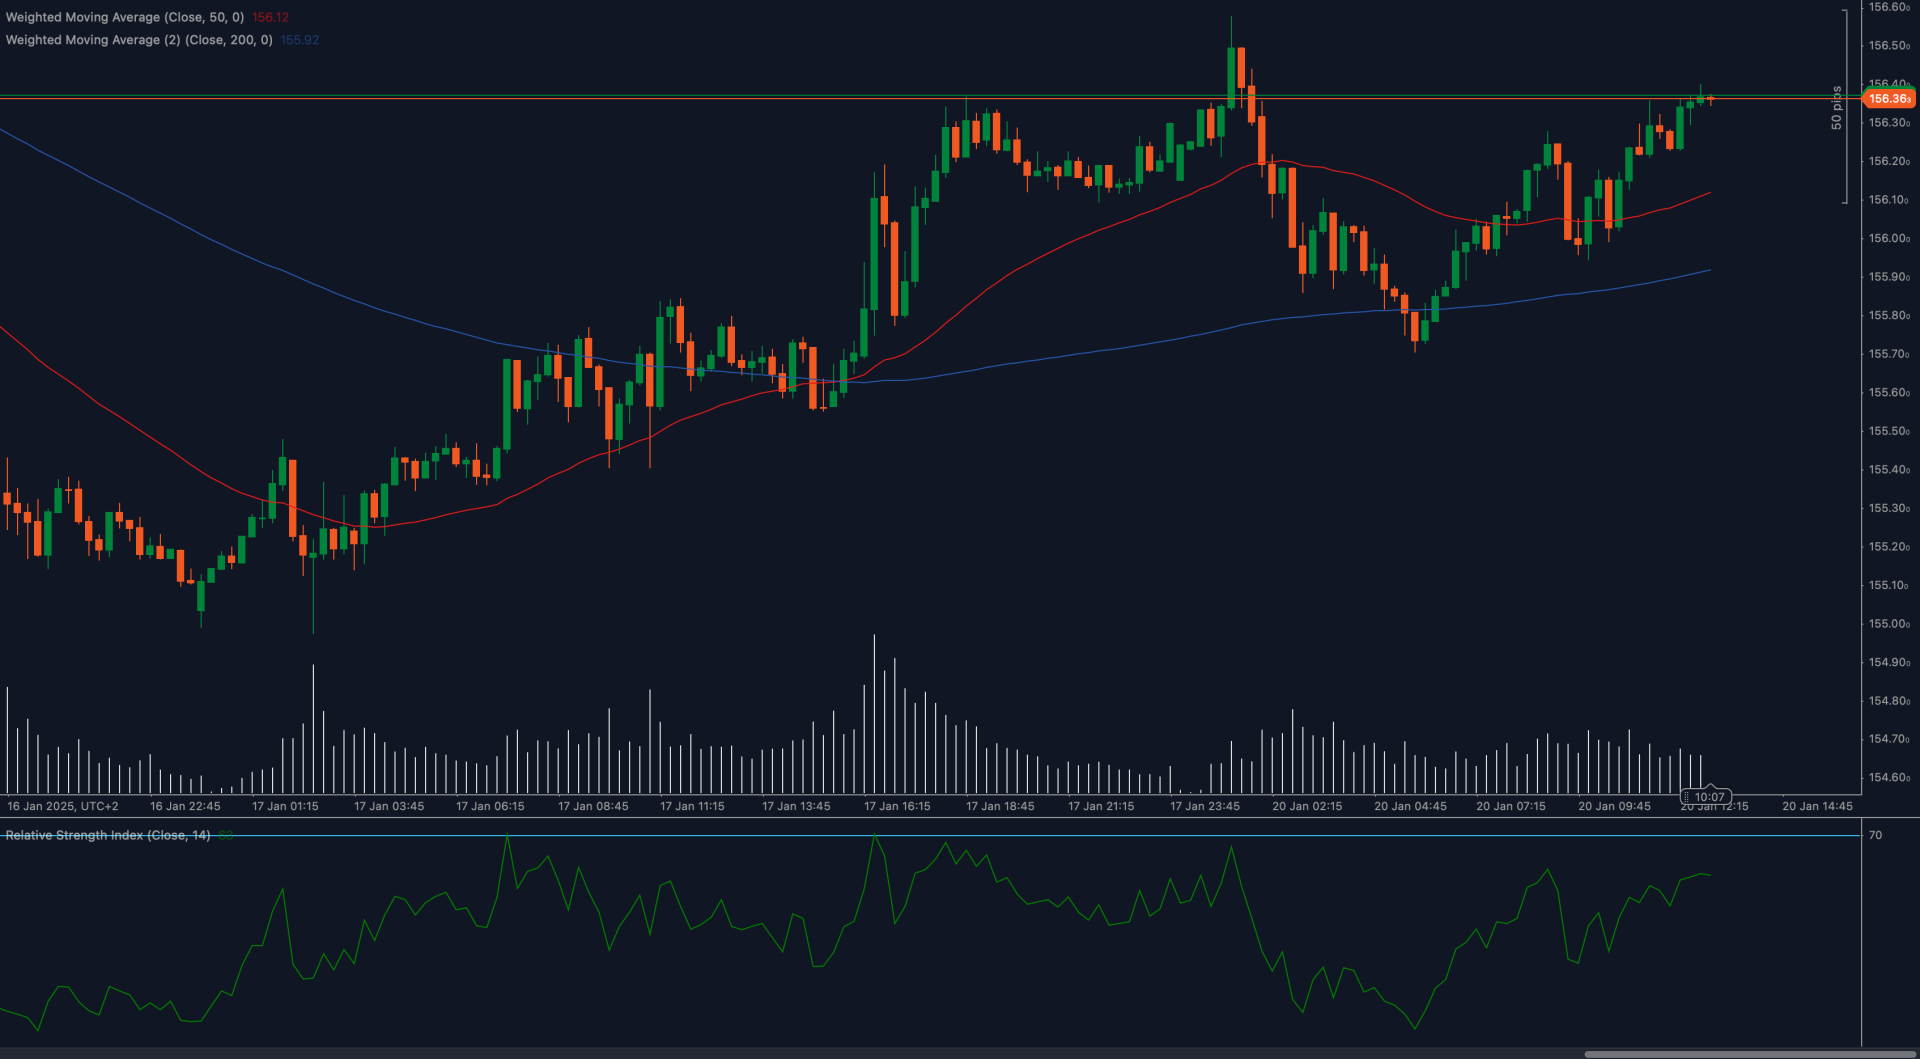
The USD/JPY pair is trading near a key 156.36 resistance level, marking a potential turning point for traders. The bullish trend remains strong, but this resistance zone could determine whether the pair continues its upward momentum or faces a short-term reversal.
📈 Moving averages support the bullish trend. The price is comfortably above both the 50 Weighted Moving Average (WMA) and the 200 WMA, which are trending upwards. These moving averages are acting as dynamic support, providing bulls with confidence. A breakout above 156.36 could trigger a rally toward the next target at 156.80, but failure to break this level may result in a pullback toward 156.00 or lower.
📊 RSI signals potential exhaustion. The Relative Strength Index (RSI) is nearing 70, which indicates overbought conditions. While this reflects strong bullish momentum, it also raises the possibility of profit-taking. For continued upward movement, RSI needs to maintain levels above 60 without showing significant divergence.
🔎 Key levels to watch:
- Support: 156.00 (short-term), 155.80 (next major support)
- Resistance: 156.36 (current), 156.80 (next breakout target)
💡 Fundamentals align with bullish sentiment. The US Dollar has strengthened recently due to rising Treasury yields and a hawkish outlook from the Federal Reserve. Meanwhile, the Japanese Yen continues to face pressure from loose monetary policy by the Bank of Japan (BoJ). Any shift in Fed or BoJ rhetoric could significantly impact USD/JPY’s direction.
🌍 156.36 is a key test. A successful breakout could push USD/JPY toward 156.80, while failure to breach this resistance may lead to consolidation or a retracement to the 156.00 support zone. Let’s watch the price action closely!


