
📊 MARKET OVERVIEW
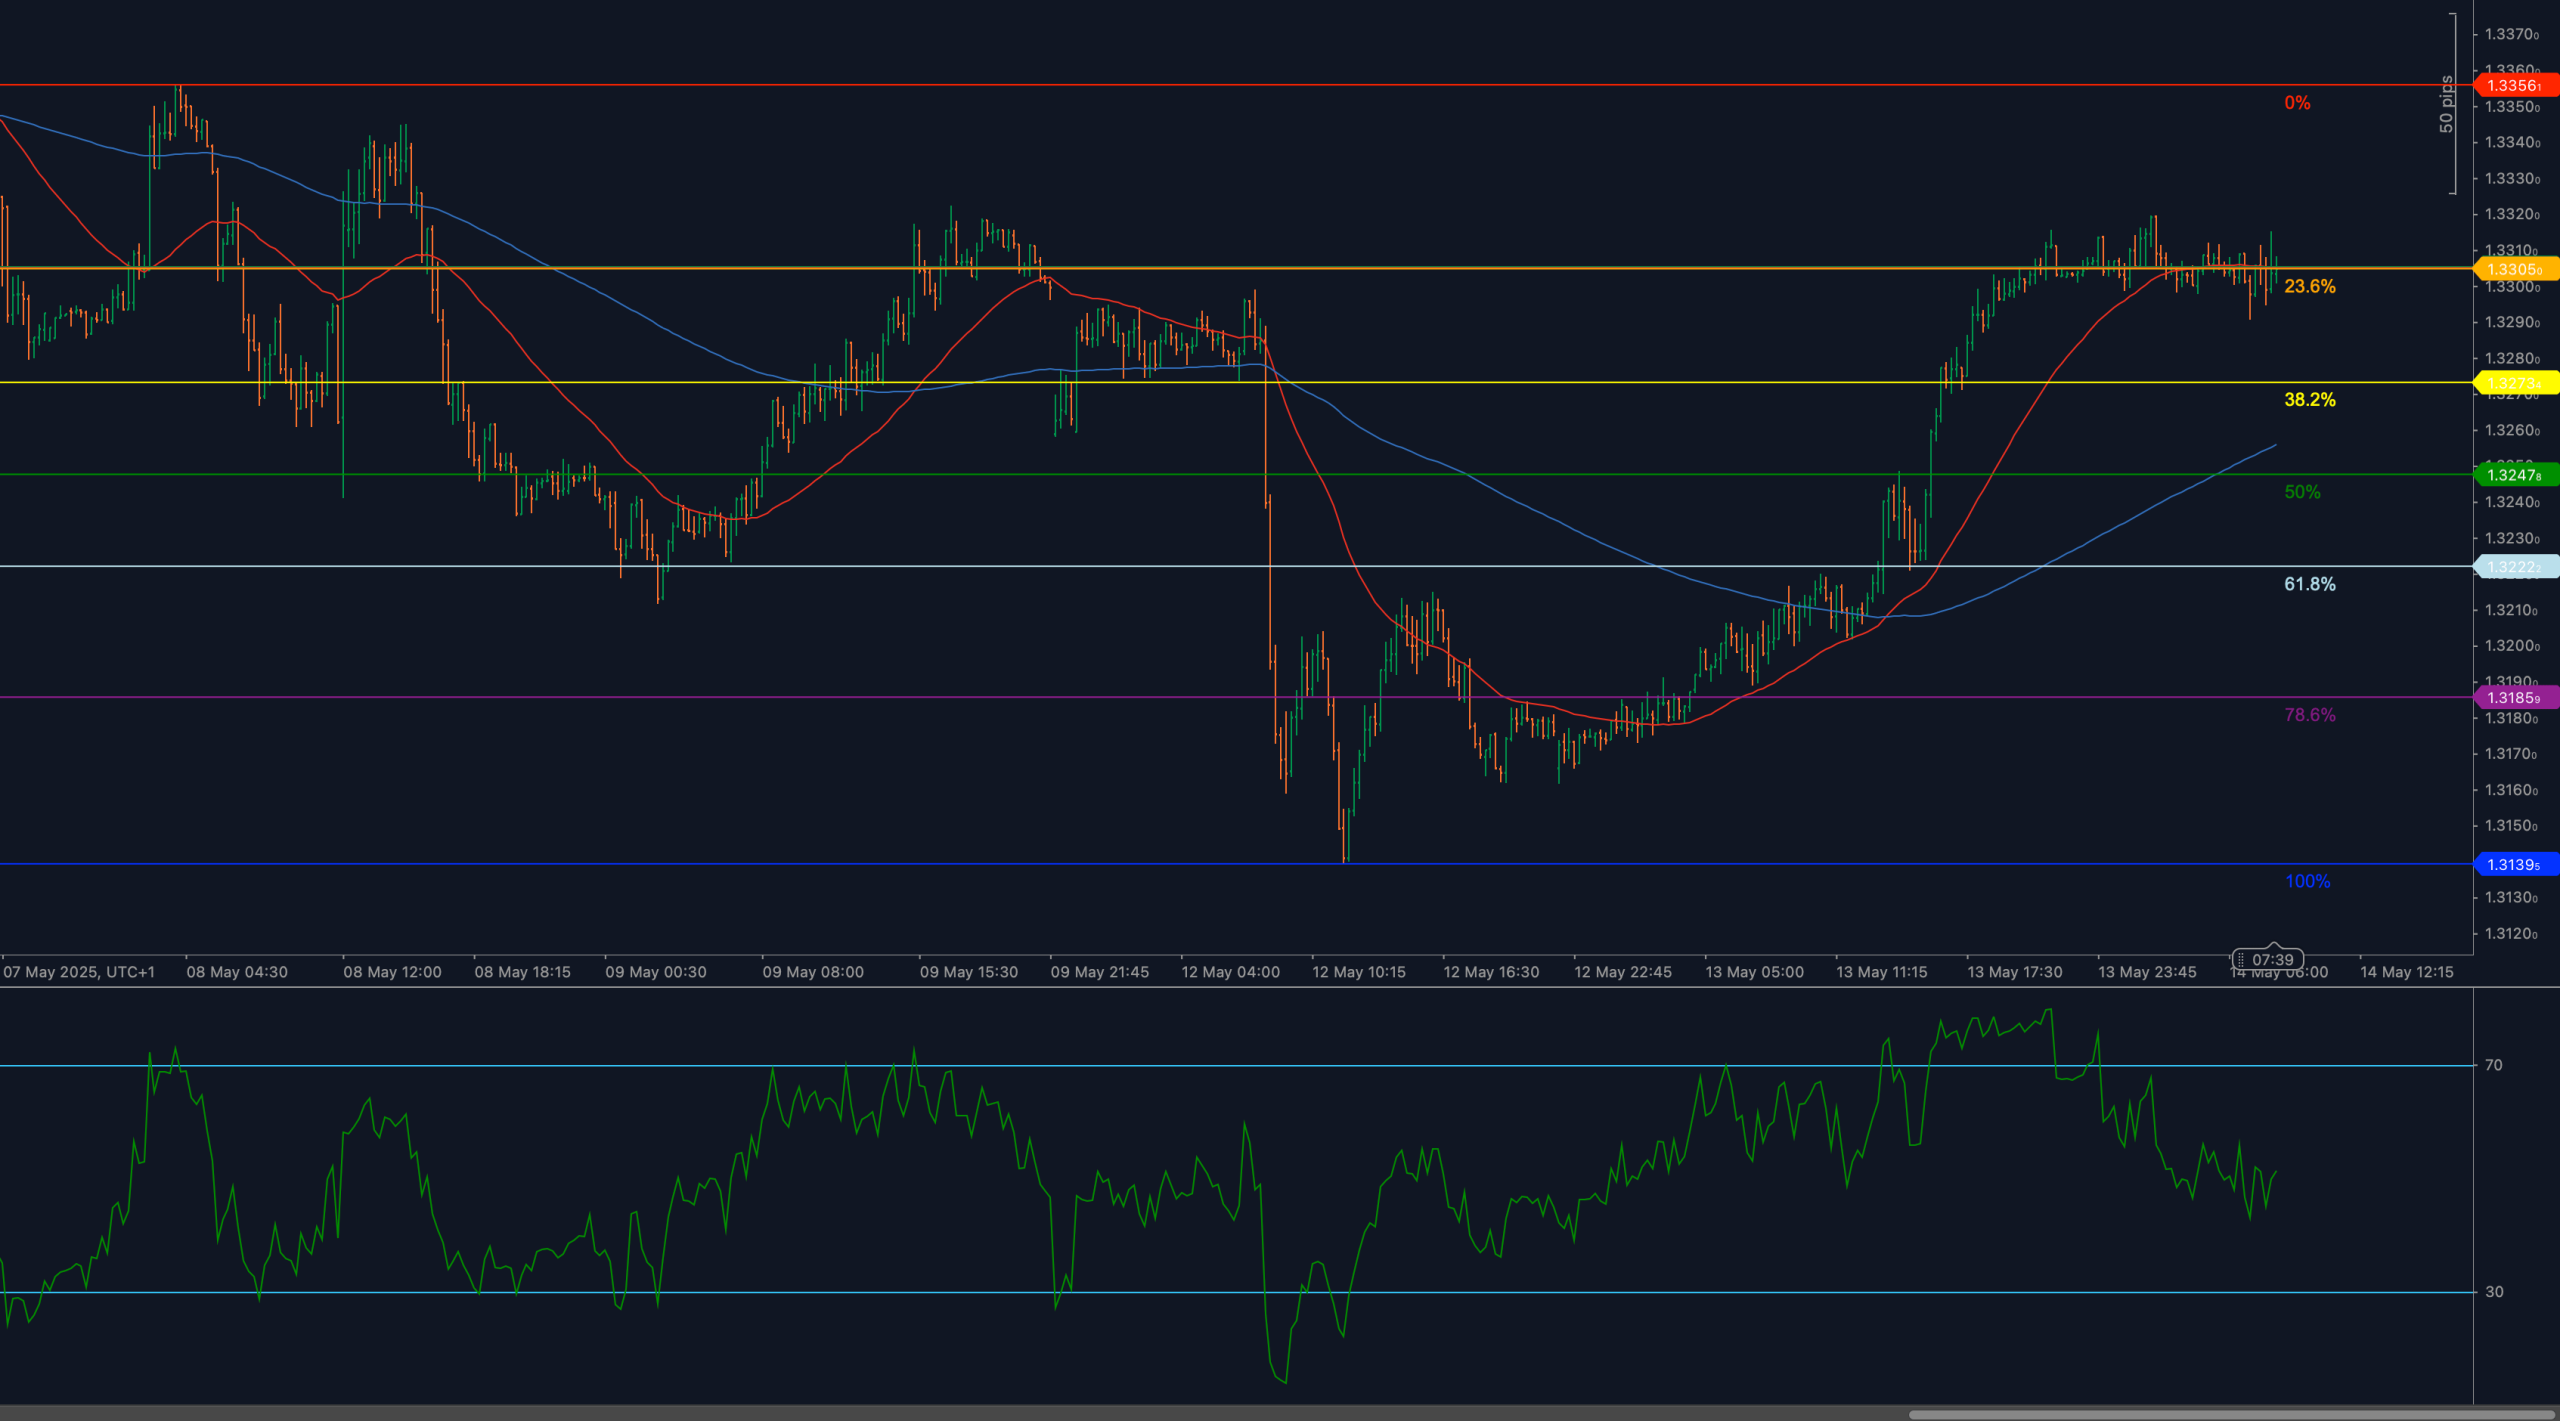
GBP/USD has staged an impressive rebound from the 1.3131 low, rallying over 190 pips before encountering significant resistance at the 1.3300–1.3305 zone. This area corresponds with the 23.6% Fibonacci retracement of the broader downswing from 1.3356 to 1.3131, and it is now serving as a critical inflection point for directional resolution.
The pound’s recovery has been supported by improved risk sentiment and short-term dollar softness, but macro fundamentals remain mixed. UK inflation expectations remain sticky while growth concerns persist, and the Bank of England’s rate path is still clouded by uncertainty. The dollar, meanwhile, continues to react to shifting U.S. data surprises and bond yield fluctuations. In this context, GBP/USD is trading more on short-term technicals than macro conviction.
Despite recent upside, bulls are now encountering a classic resistance test that could define the near-term trend structure. Without a decisive break above the 1.3305 barrier, the move risks reverting into a corrective retracement.
📈 TECHNICAL ANALYSIS
Key Support and Resistance Levels
Immediate resistance is found at 1.3300–1.3305, which marks the 23.6% Fibonacci retracement and a prior consolidation ceiling from late April. If bulls manage to reclaim this zone with strong candle closes, it would open the door to further upside toward 1.3356, the swing high and completion point of the prior impulsive leg.
On the downside, minor support is located at 1.3267, followed by the 38.2% Fibonacci level at 1.3250, which now aligns closely with short-term moving average pivots. A deeper pullback could expose 1.3227 (50% retracement) and 1.3185 (78.6%), both of which have historically acted as reaction zones. A failure to hold above the 1.3240–1.3250 band would shift structure decisively back toward bearish continuation.
Moving Averages and Dynamic Price Action
The pair is currently trading above both the 50-period and 200-period weighted moving averages, which are beginning to turn upward after a long period of compression and decline. This is the first time in over a week that moving average alignment has turned supportive for bulls. However, price action has stalled just beneath the flattened 200-WMA, indicating that bullish momentum may still be fragile.
The 50-WMA is now curling upward and tracking price from below, offering dynamic short-term support near 1.3250. This area is likely to serve as a critical defense point. A break beneath the confluence of the 50-WMA and 38.2% retracement would signal a loss of upward momentum and increase risk of reversion to deeper support zones.
RSI Momentum and Bullish Pressure
The 14-period RSI climbed aggressively from sub-35 levels during the rally off 1.3131 and briefly approached 65, but has since rolled over to just below 55, reflecting a weakening of bullish pressure. The inability of RSI to stay elevated or punch through the 60–70 zone confirms that momentum remains cautious rather than explosive.
A renewed push above 60 would be needed to confirm strength and support a breakout above 1.3305. Alternatively, if RSI drops below 50 while price fails to hold 1.3250, it would likely signal deeper correction or breakdown risk.
Candlestick Behavior and Price Action Clarity
Recent candlestick structure shows upper shadows near 1.3300 and diminishing bullish body size, suggesting waning buying interest and an increase in selling activity at resistance. No strong bullish continuation candles have emerged, and volume has also faded on recent upswings.
If a breakout is to occur, traders will want to see a strong-bodied candle close above 1.3305 with minimal upper wick and confirmation in the following session. For now, price appears capped, and the current sequence leans toward consolidation or retracement unless new momentum is injected.
Chart Structure and Breakout Formation
The broader structure appears as a corrective rebound within a larger downtrend, potentially forming a bear flag or double-top rejection near 1.3300. The rally from 1.3131 was swift, but it came after a sharp selloff that carved out a clean impulse leg. Unless buyers confirm a new higher high above 1.3356, this rebound may ultimately prove to be a counter-trend correction rather than the beginning of a new bullish phase.
The rejection near the 23.6% retracement also adds weight to the idea that this level is functioning as the midpoint resistance zone within the larger trend framework. A confirmed breakdown below 1.3240 would effectively neutralize the short-term rally and shift bias back toward bearish re-engagement.
Fibonacci Retracement and Extension Levels
The Fibonacci retracement from 1.3356 to 1.3131 defines the key technical structure. Price has reached the 23.6% retracement at 1.3305, which is often a critical zone for corrective stalls. The 38.2% level at 1.3250, 50% at 1.3227, and 61.8% at 1.3203 form the underlying support stack. A breakdown through these levels could expose a move back toward the 78.6% retracement at 1.3185, or even full retracement at 1.3131.
On the upside, a breakout above 1.3305 would target the April swing high at 1.3356, followed by extension levels near 1.3400 if momentum accelerates.
🔍 MARKET OUTLOOK & TRADING SCENARIOS
Bullish Scenario
If price breaks and closes above 1.3305, with RSI reclaiming 60+, GBP/USD could resume its rebound toward 1.3356and higher. A close above the 200-WMA would offer strong technical validation and attract fresh bullish momentum, particularly if the move is accompanied by rising volume.
Neutral Scenario
Price remains range-bound between 1.3250 and 1.3300, with RSI oscillating between 50–55. This outcome would reflect indecision, positioning the market for either a base-building breakout or a rollover into retracement. Traders would wait for volume and candle confirmation before engaging directionally.
Bearish Scenario
A break below 1.3240, especially on strong bearish candles and RSI falling below 50, would reintroduce downside pressure and target 1.3227, then 1.3185. A full unwind to 1.3131 could follow if macro or risk sentiment deteriorates.
💼 TRADING CONSIDERATIONS
Bulls may consider entries on confirmed breakout above 1.3305, with stops below 1.3250 and upside targets at 1.3356and beyond. Bears are likely to enter on rejection candles near 1.3300 or breakdowns through 1.3240, targeting 1.3227 and 1.3185. Until price resolves the current Fibonacci range, short-term volatility is expected within the 50-pip band.
🏁 CONCLUSION
GBP/USD has recovered sharply but now finds itself constrained beneath the 1.3300–1.3305 Fibonacci resistance, where momentum is weakening and RSI is failing to confirm a breakout. The overall structure remains mixed, with bulls in need of a decisive breakout to extend gains. Unless 1.3305 is cleared with conviction, the pair may slide back into corrective territory, targeting the 1.3250–1.3185 support zone.
⚠️ DISCLAIMER
This analysis is for informational purposes only and does not constitute financial advice. Always consult with a licensed financial professional before making trading decisions.


