
📊 MARKET OVERVIEW
The British pound (GBP/USD) is under pressure once again after an aggressive drop from recent highs above 1.3420. The pair is currently testing the 1.3370 support level, which previously acted as a consolidation base during last week’s rally. A breakdown below this zone could signal the end of the bullish trend that dominated mid-April.
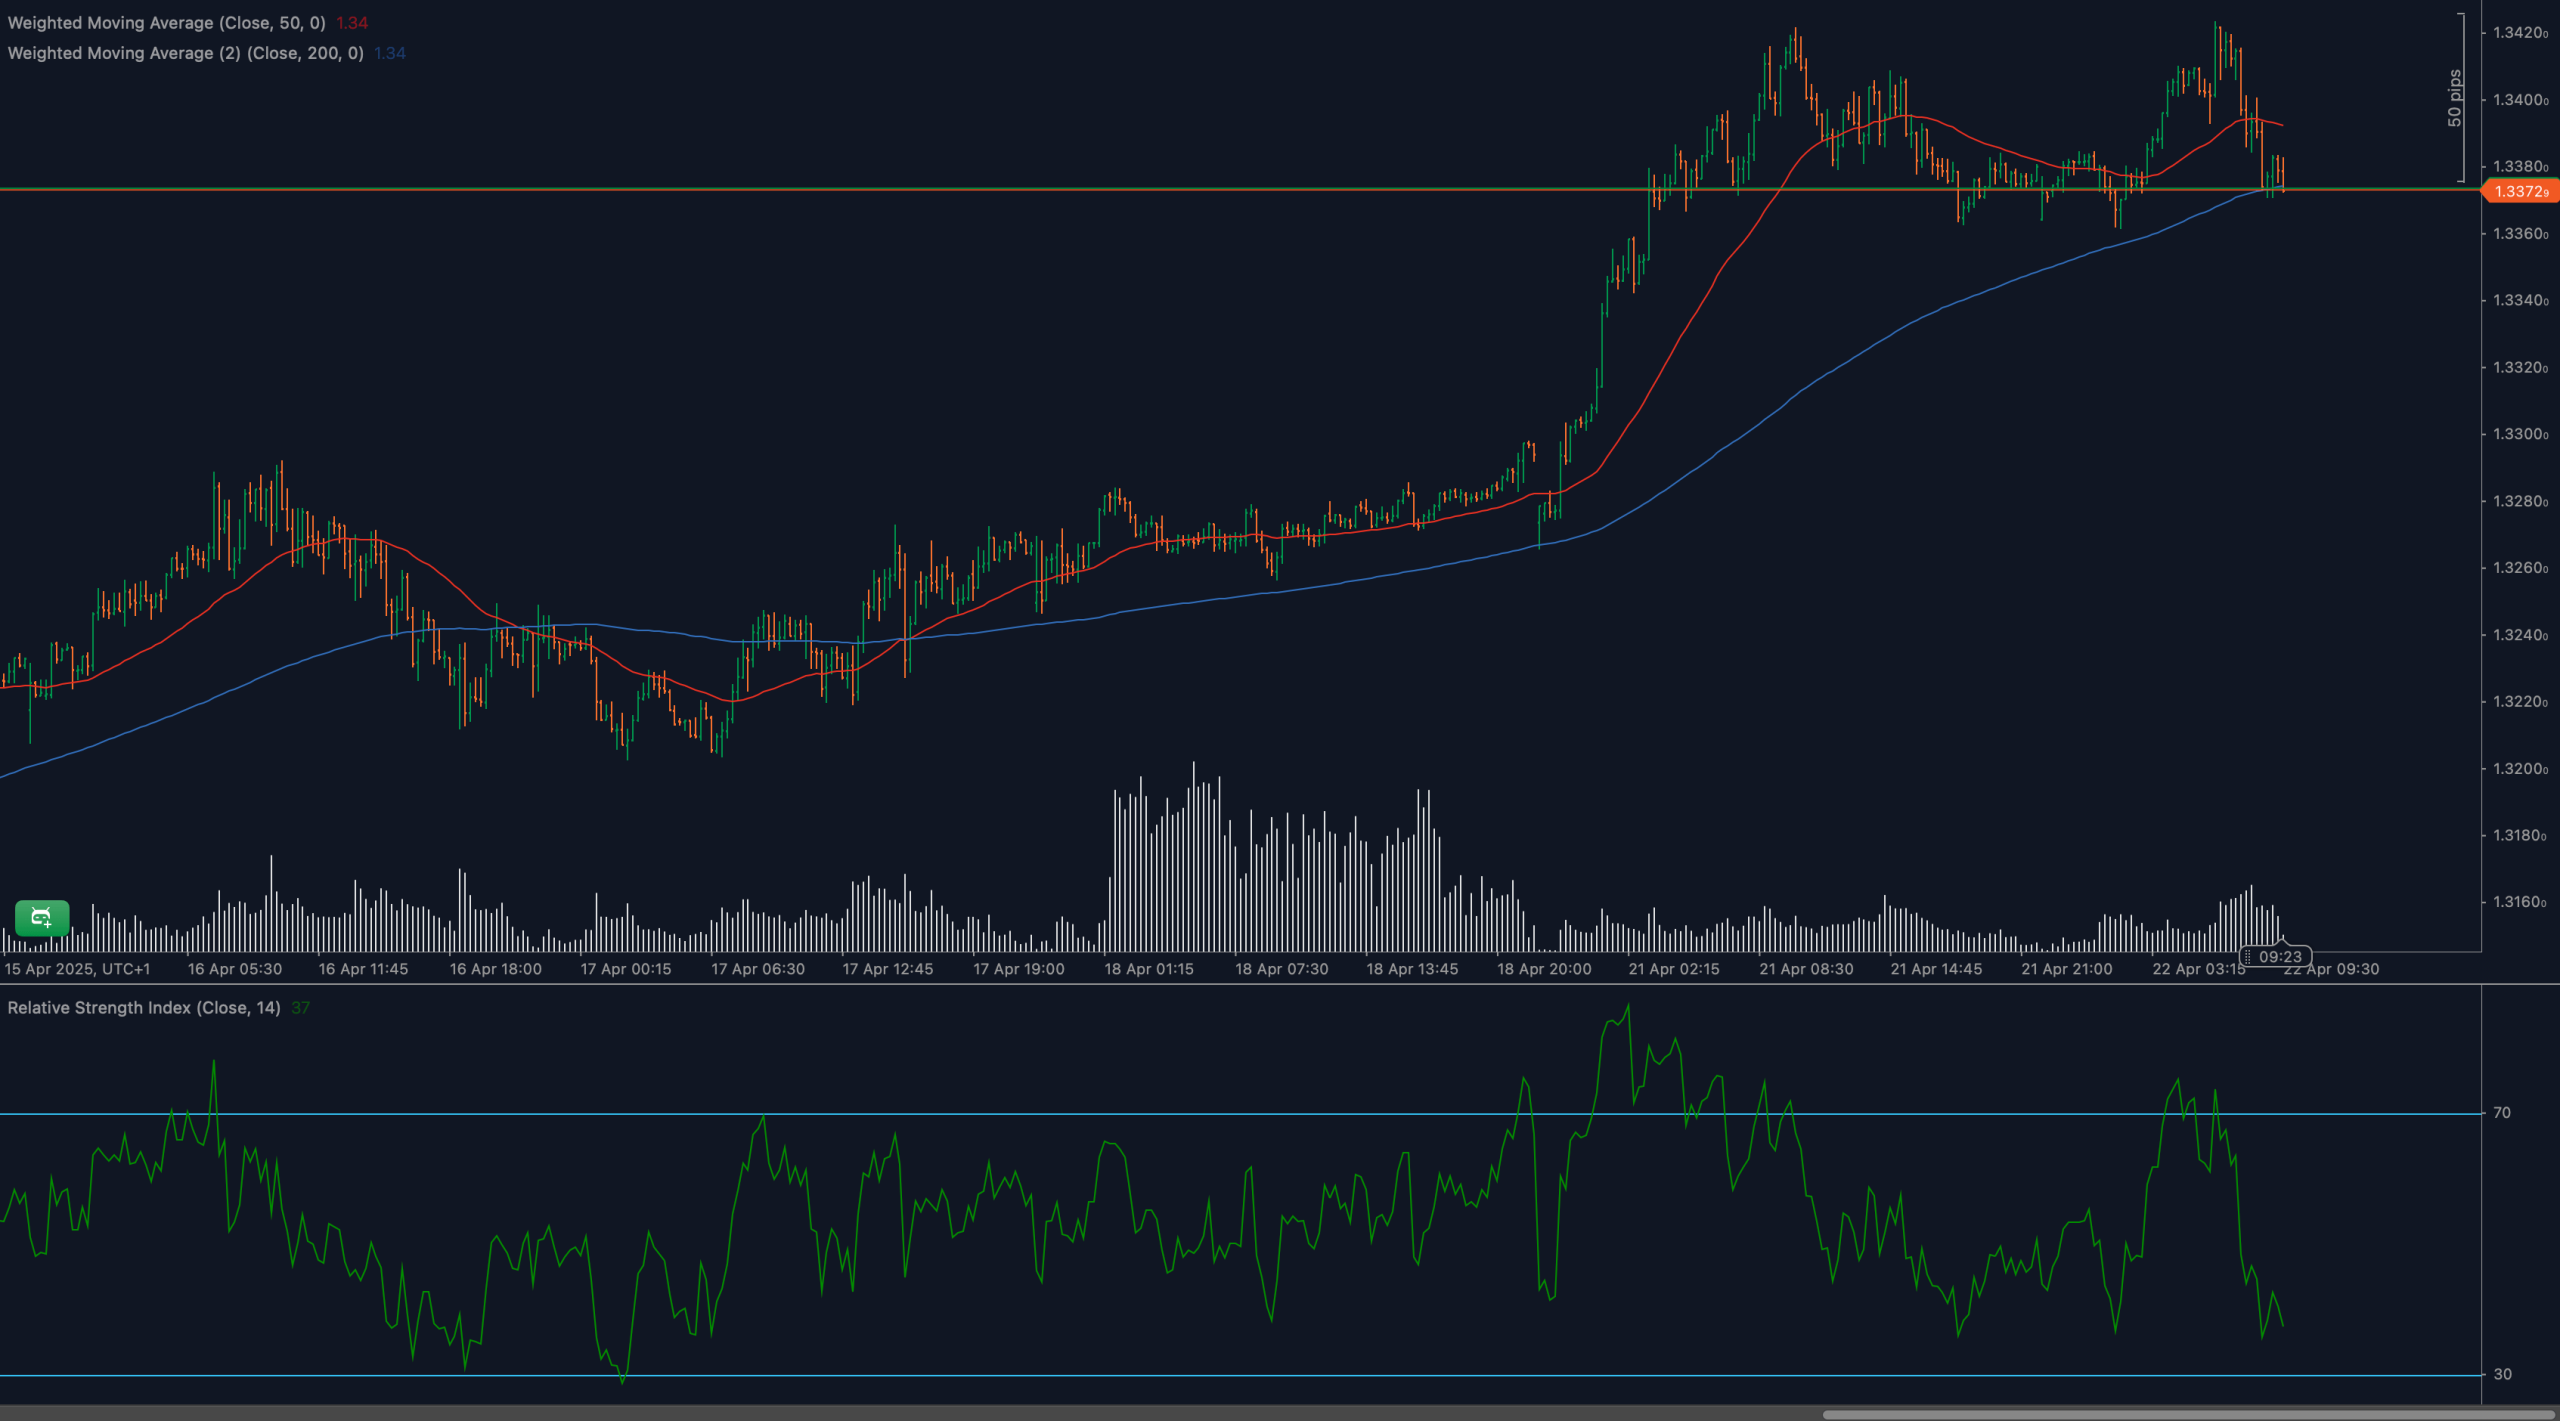
Currently, the pair is trading below the 50-period WMA while hovering near the 200-period WMA — a key dynamic support that could determine whether bulls can regroup or bears take full control. RSI is falling, and momentum appears to favor a bearish continuation unless a strong bounce emerges soon.
📈 TECHNICAL ANALYSIS
What Are the Key Support and Resistance Levels for GBP/USD?
Immediate support is located at 1.3370, a level that has been tested multiple times in recent sessions. If broken, price could move toward 1.3340 and 1.3300. To the upside, resistance is found at 1.3405, followed by the previous swing high near 1.3425.
Moving Average Analysis and Dynamic Price Levels
Price has slipped below the 50-period WMA (1.3434) and is now sitting right on the 200-period WMA (1.3374). This alignment suggests a loss of short-term bullish momentum. If the 200-WMA fails to hold, it could trigger a broader trend shift. The slope of the 50-WMA is flattening — another early warning that momentum is weakening.
RSI Momentum Analysis and Divergence Patterns
The 14-period RSI is currently around 37, showing a clear drop in bullish strength. This decline into bearish territory reflects increasing downside pressure. No clear divergence is visible, but the RSI failing to hold above 50 during the last recovery is a warning sign that buyers are losing conviction.
Price Action and Candlestick Analysis
Candlestick behavior near 1.3370 has turned reactive, with long lower wicks suggesting some demand at this level — but not yet strong enough to reverse the trend. The last few candles are predominantly bearish, with momentum accelerating downward. A bullish reversal pattern would be needed to validate any bounce setup from here.
Chart Patterns and Formation Analysis
The current setup resembles a rounded top or a distribution phase, with lower highs forming below resistance. If the 1.3370 support breaks decisively, this would confirm a transition into a short-term bearish trend. Conversely, a strong bullish engulfing candle at support could suggest another leg higher within the broader uptrend.
Fibonacci Retracement Levels and Extension Targets
Using the swing low at 1.3260 and the high near 1.3425, the 38.2% Fibonacci retracement rests at 1.3365, aligning almost perfectly with current price. The 50% retracement lies at 1.3340, and the 61.8% level at 1.3315. These retracement levels are key supports if price continues to decline.
🔍 MARKET OUTLOOK & TRADING SCENARIOS
Bullish Scenario for GBP/USD
If GBP/USD holds above 1.3370 and forms a bullish reversal candle, traders could anticipate a bounce toward 1.3405and 1.3425. RSI would need to reclaim 45–50, and volume would have to rise on green candles to confirm a potential short-term floor.
Neutral Scenario for GBP/USD
Should price remain range-bound between 1.3370 and 1.3405, this may signal consolidation. RSI stabilizing between 40–50 and low-volume candles would support a sideways thesis. This scenario could benefit scalpers and short-term range traders.
Bearish Scenario for GBP/USD
A breakdown below 1.3370, followed by sustained closes below the 200-WMA, would confirm a bearish outlook. RSI dipping below 35 would strengthen this signal, targeting 1.3340 and 1.3300 in the short term. A failure to reclaim the 50-WMA on pullbacks would further reinforce bearish pressure.
💼 TRADING CONSIDERATIONS
For bullish setups, wait for confirmation of a reversal at 1.3370 with bullish engulfing or hammer candles and volume support. Targets include 1.3405 and 1.3425, with stops below 1.3340.
Bearish traders could look for short entries below 1.3365, especially on rising bearish volume and RSI weakness. Downside targets include 1.3340 and 1.3315, with stops above 1.3390.
🏁 CONCLUSION
GBP/USD is at a crucial inflection point as it tests the 1.3370 support zone. With RSI weakening and moving averages beginning to align bearishly, downside risks are increasing. However, this zone has held multiple times before — making confirmation key. A decisive break or reversal from here will define the next directional leg.
⚠️ DISCLAIMER
This analysis is for informational purposes only and does not constitute trading advice. Always perform your own research and consult with a licensed financial advisor before making trading decisions.


