
📊 MARKET OVERVIEW
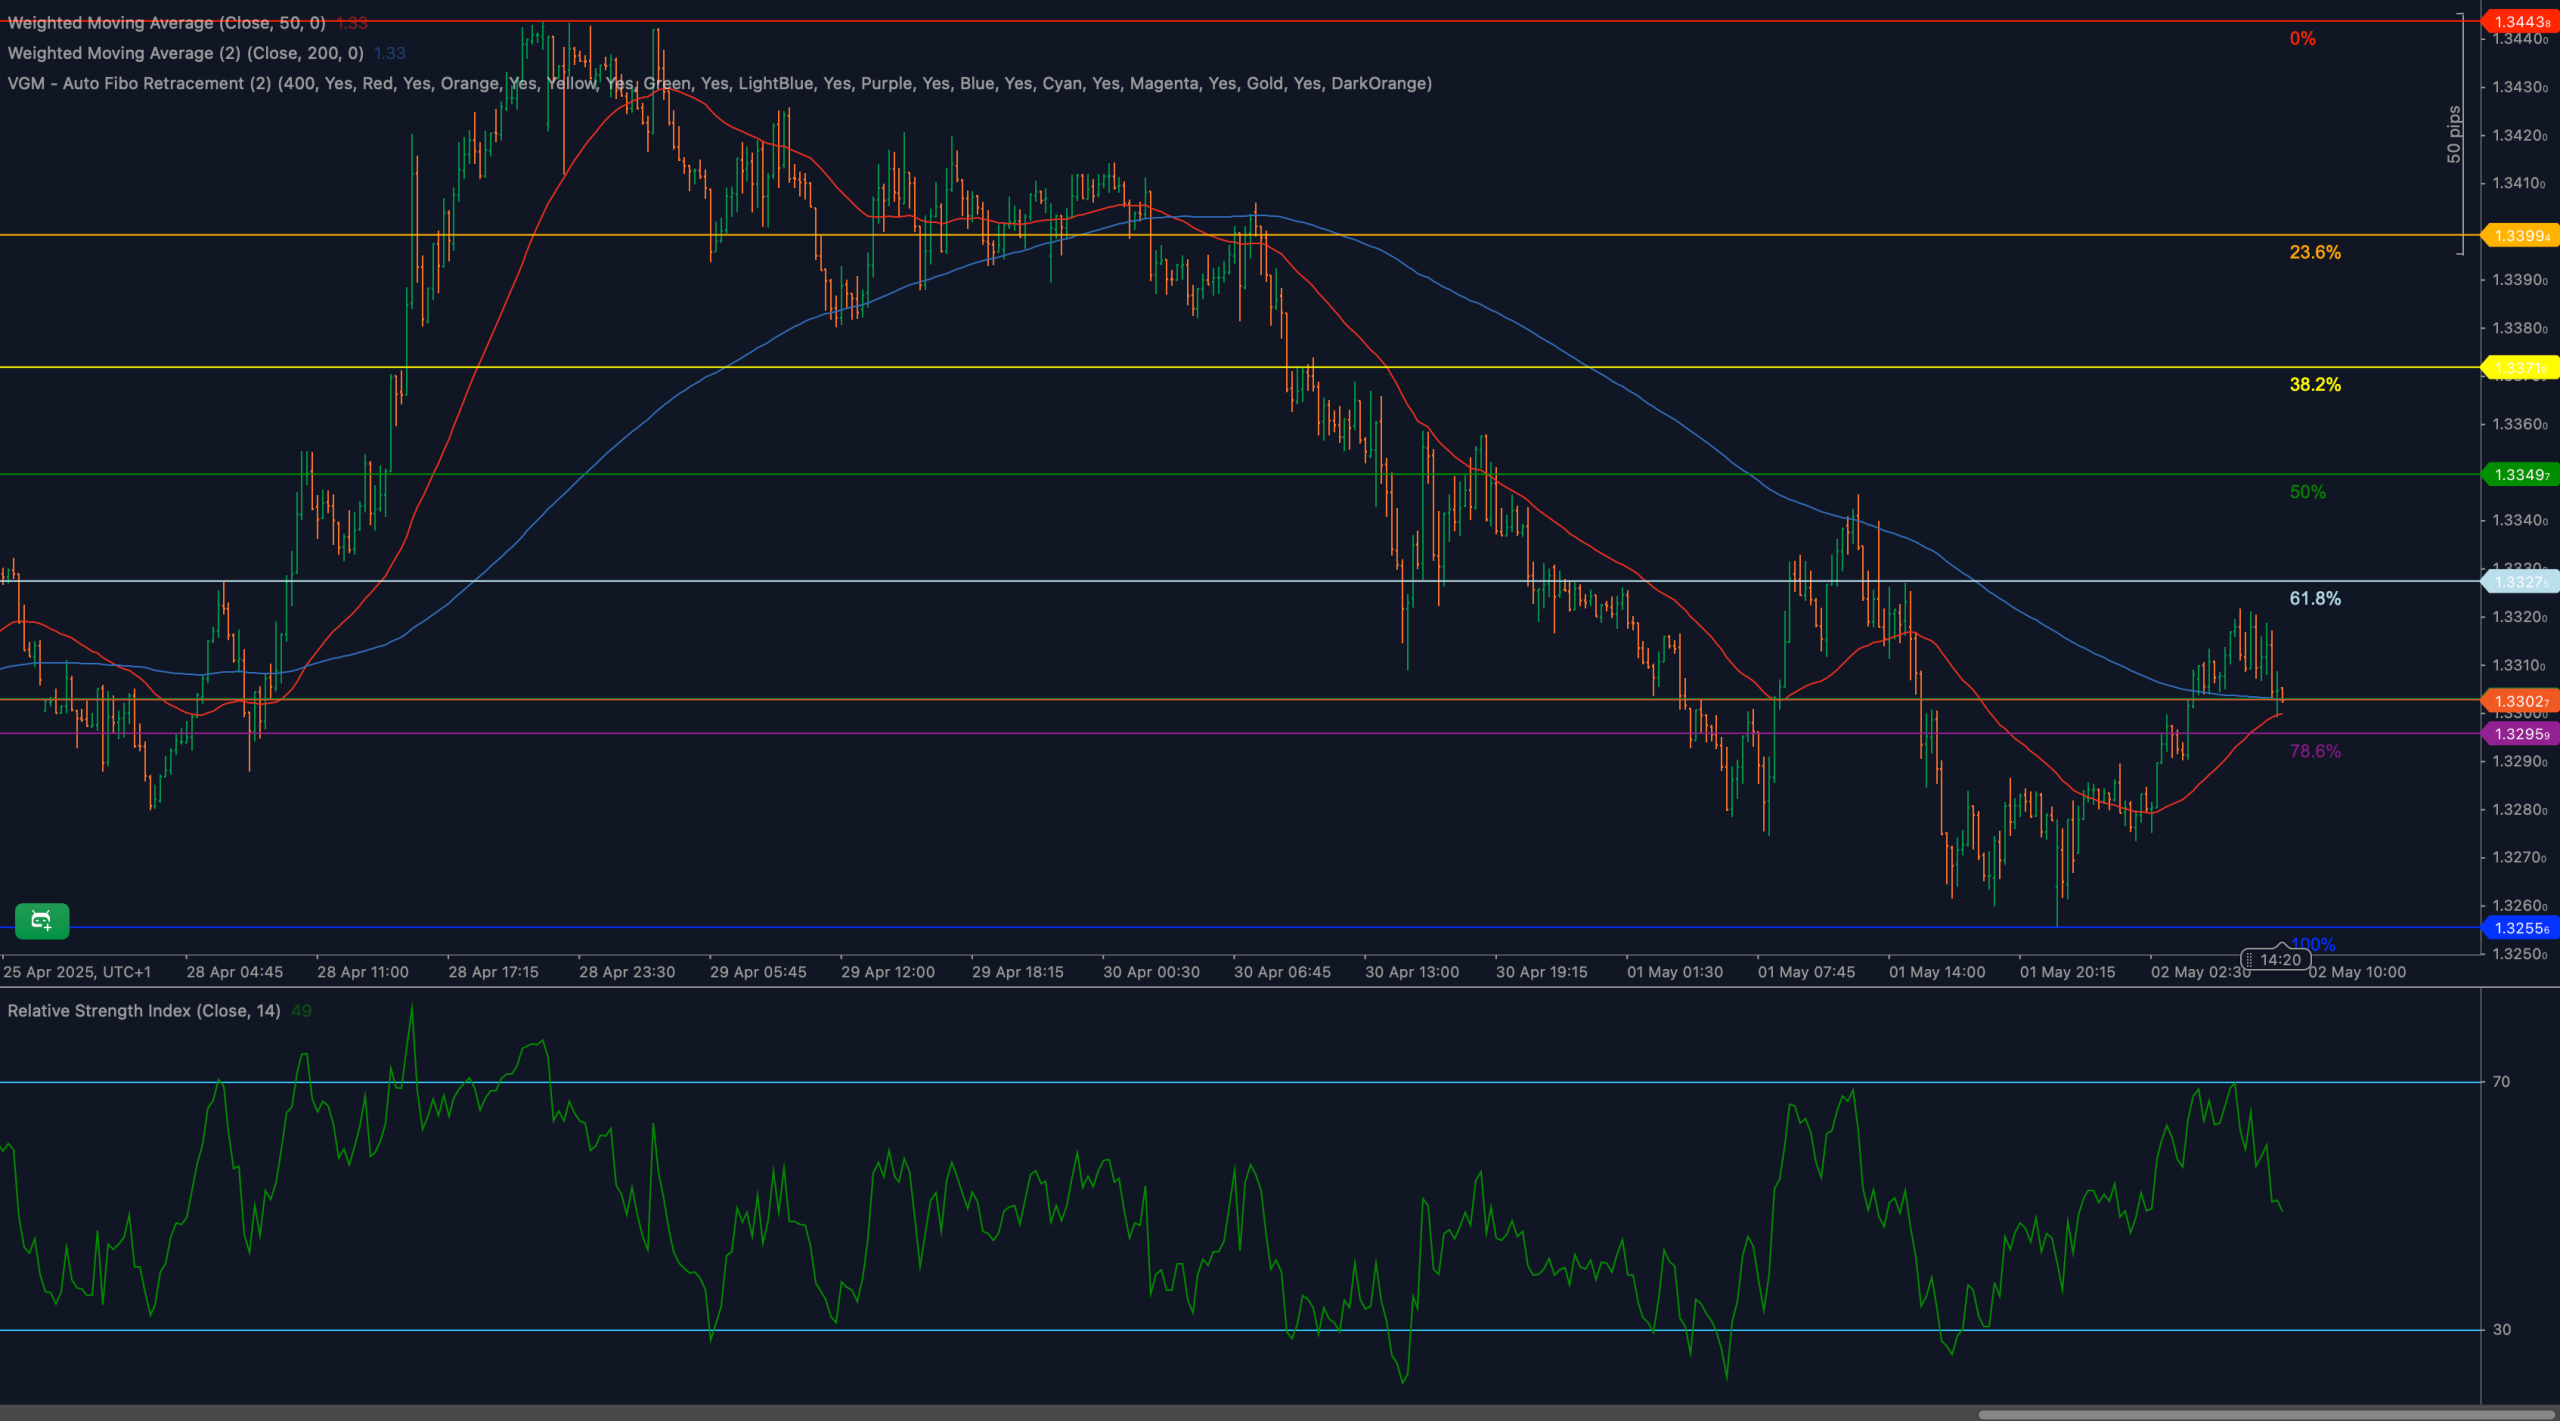
GBP/USD is at a pivotal moment, hovering around the 1.3330 level — which aligns with the 61.8% Fibonacci retracement of the recent decline from 1.3444 to 1.3256. After a sharp rebound off the April lows, price is now pausing at this key technical resistance zone.
Both moving averages are converging, and RSI momentum is fading just below the 50 level. The pair is at risk of rolling over unless bulls reclaim control with fresh momentum. A bounce or breakdown from here will likely shape the near-term trend.
📈 TECHNICAL ANALYSIS
What Are the Key Support and Resistance Levels for GBP/USD?
Immediate support is found at 1.3330, the 61.8% Fibonacci level. Below that, additional support zones lie at 1.3302(trend structure) and 1.3295 (78.6% retracement). Resistance stands at 1.3349 (50% retracement), followed by 1.3375and the previous swing high at 1.3399.
Moving Average Analysis and Dynamic Price Levels
GBP/USD is trading slightly above the 50-period WMA (1.3302) and near the 200-period WMA (1.3330). These averages are currently flattening, indicating potential for trend transition. If price holds above both, bulls could build a base — but a drop below both averages would quickly tip the bias back to bearish.
RSI Momentum Analysis and Divergence Patterns
The 14-period RSI has rolled off recent highs and now reads around 48, showing fading bullish momentum. Although still in neutral territory, the recent lower high in RSI warns of possible divergence if price fails to push higher. A move below 45 could confirm a shift in momentum bias.
Price Action and Candlestick Analysis
Price action shows hesitation near 1.3330 with multiple small-bodied candles and rejection wicks. This suggests supply is emerging at the Fibonacci level. A strong bullish close above 1.3349 would invalidate the weakness — while a bearish engulfing or breakdown below 1.3300 would add pressure.
Chart Patterns and Formation Analysis
The current structure appears to be a rising wedge or flag developing off the base near 1.3256. The stalling price at 61.8% adds weight to the idea that this may be a corrective retracement rather than a full reversal. If price breaks lower from this wedge, it could confirm a bearish continuation pattern.
Fibonacci Retracement Levels and Extension Targets
- 61.8% retracement: 1.3330 (current level)
- 78.6% retracement: 1.3295 (major confluence with prior structure)
- 100% swing: 1.3256 (the full retracement low)
Extension targets, if 1.3330 holds and price breaks above 1.3349, would project to 1.3375 (127.2%) and 1.3399(161.8%).
🔍 MARKET OUTLOOK & TRADING SCENARIOS
Bullish Scenario for GBP/USD
If price holds 1.3330 and reclaims 1.3349, a move toward 1.3375 and 1.3399 becomes viable. RSI would need to push back above 52, and candles would need to show strong bullish momentum to confirm upside.
Neutral Scenario for GBP/USD
Should GBP/USD remain in a tight range between 1.3302–1.3349, the market may consolidate while awaiting macro catalysts. RSI around 45–50 and flat moving averages support a sideways scenario.
Bearish Scenario for GBP/USD
A close below 1.3300 would confirm loss of momentum, especially if RSI dips below 45. In that case, price could revisit 1.3295, and if broken, decline further to 1.3256.
💼 TRADING CONSIDERATIONS
- Bullish setup: Look for bounce confirmation at 1.3330, with targets at 1.3375–1.3399, and stops below 1.3295
- Bearish setup: Short on breakdown below 1.3300, targeting 1.3256, with stops above 1.3345
Risk management is key as this zone is both structurally and psychologically pivotal.
🏁 CONCLUSION
GBP/USD is stalling at a key technical level — the 61.8% Fibonacci near 1.3330. RSI is fading, and price is at risk of turning unless buyers defend this zone. Watch for either breakout toward 1.3375 or breakdown back toward 1.3256. This is a key inflection point for the pair.
⚠️ DISCLAIMER
This analysis is for informational purposes only and does not constitute financial advice. Please consult with a licensed professional before making any trading decisions.


