
📊 MARKET OVERVIEW
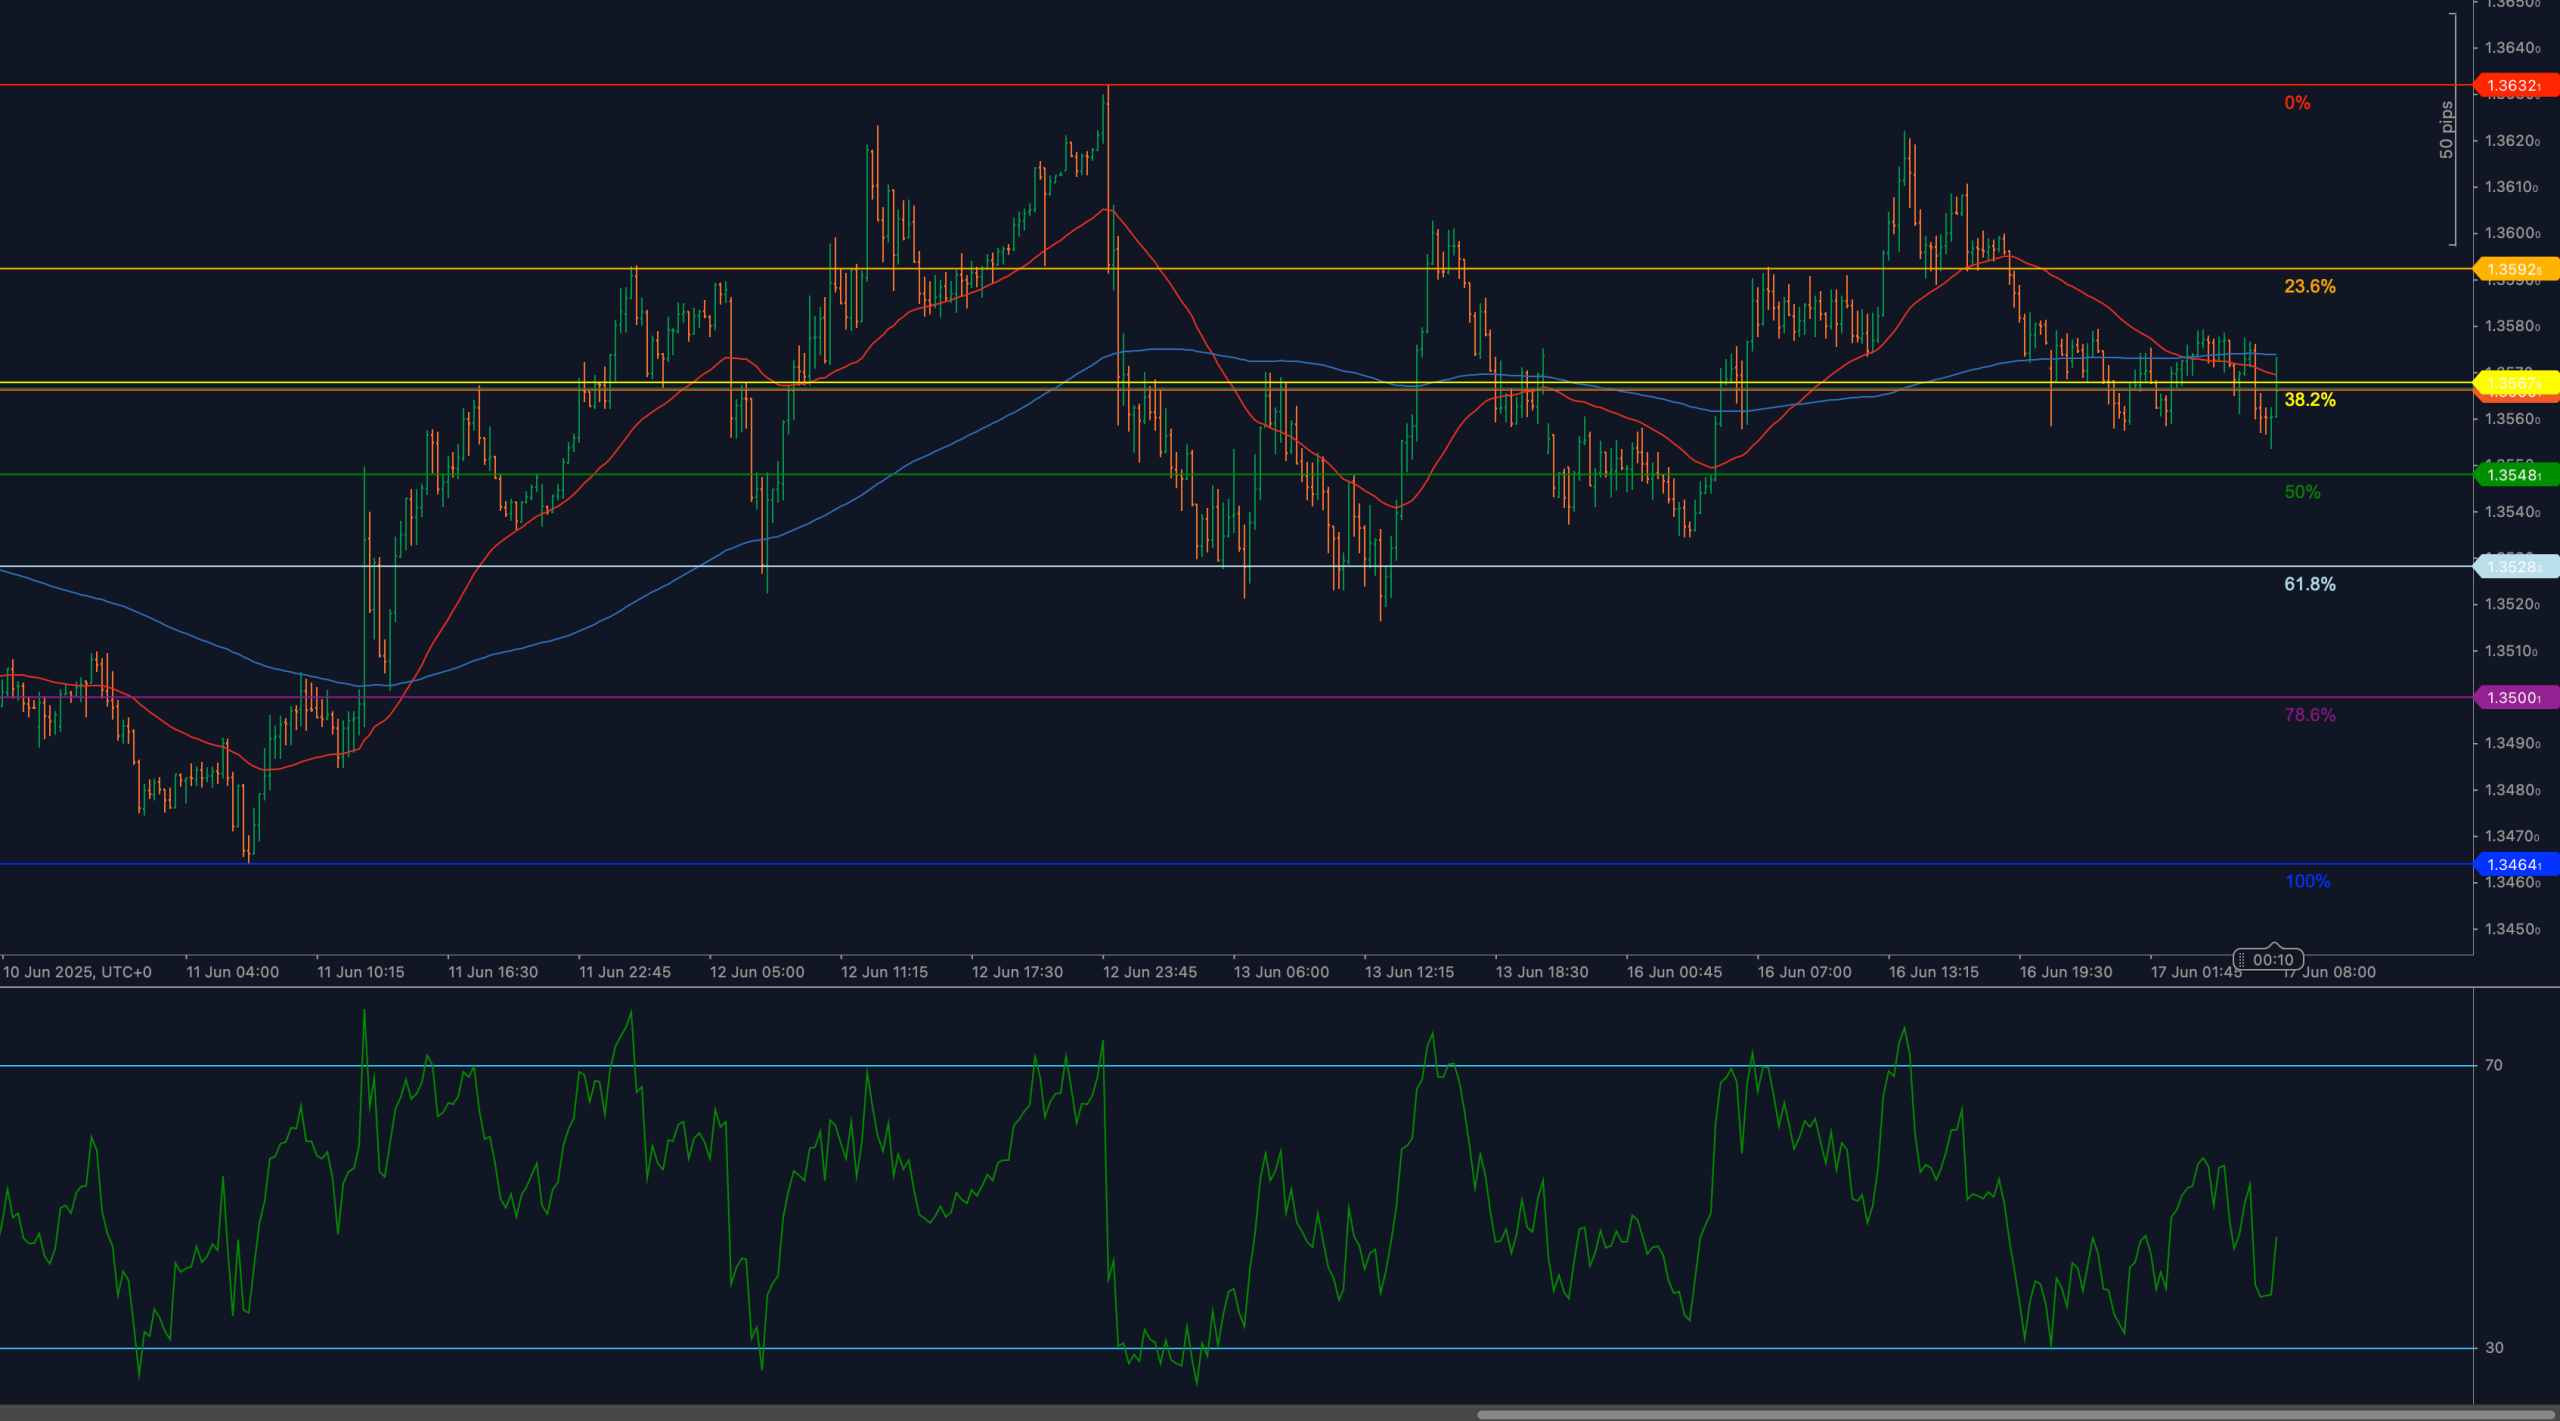
GBP/USD is showing clear signs of weakening structure after decisively breaking below the 1.3580 zone, which marks the 38.2% Fibonacci retracement from the 1.3446–1.3632 bullish leg. The pair had previously maintained a consolidation band above the moving averages, but that structure has now broken down.
This shift occurs as market momentum softens and recent bullish attempts fail to hold. Price has dipped below both the 50 and 200-period Weighted Moving Averages (WMAs), reflecting a deterioration in short-term trend dynamics. Without a strong reversal, bears may continue to gain control as attention turns toward deeper retracement zones.
📈 TECHNICAL ANALYSIS
Key Support and Resistance Levels
Immediate support is now found at 1.3548, the 50% Fibonacci retracement, followed by 1.3528, the 61.8% level, which may act as the last bullish defense in this corrective wave. If these supports fail, price could slip toward the 1.3500 (78.6%) or even 1.3446 (full retracement) level.
On the upside, 1.3580 now becomes initial resistance, followed by 1.3592 (23.6% Fib) and 1.3632 (swing high). A close above 1.3600 would be required to negate the bearish tilt and reestablish upward momentum.
Moving Averages and Dynamic Price Action
The pair is now trading beneath both the 50-period and 200-period Weighted Moving Averages. The 50-WMA has begun to turn lower, confirming a structural shift, while the 200-WMA has flattened, losing its directional bias. These levels, previously acting as dynamic support, have flipped to resistance and now cluster near 1.3580–1.3590.
As long as price remains beneath this zone, rallies are likely to be corrective and short-lived.
RSI Momentum and Bearish Pressure
The 14-period RSI has turned downward, currently hovering near 40, indicating growing bearish momentum. It remains above oversold territory, but the trend is clearly negative.
No bullish divergence is present. A dip below 35–30 would validate further bearish continuation. Conversely, a rebound above 50 may signal temporary stabilization, but for now, RSI favors sellers.
Candlestick Behavior and Price Action Clarity
Recent candles display long-bodied bearish closes with minimal lower wicks — a sign of firm downside pressure. No bullish engulfing or pin bar formations have emerged. The breakdown below 1.3580 was confirmed on strong follow-through.
Unless a large-bodied bullish candle reclaims lost ground above 1.3580, there is little indication that sentiment is shifting.
Chart Structure and Breakdown Formation
The chart now exhibits a rounded topping formation, with a visible failure to hold higher lows. The neckline near 1.3580 has been breached, and price is now following a path aligned with descending swing structure.
This breakdown opens the door to a deeper correction, particularly if no immediate support reaction appears near the next Fib levels.
Fibonacci Retracement and Extension Levels
The retracement from the 1.3446 swing low to the 1.3632 high outlines key support clusters. With 1.3580 (38.2%) now broken, eyes turn to 1.3548 (50%) and 1.3528 (61.8%). These levels are critical. A hold here could spark a rebound; failure would point to a retest of the 1.3500 (78.6%) or 1.3446 (100%) retracement zone.
Current structure favors bearish continuation unless those supports hold and RSI begins to climb.
🔍 MARKET OUTLOOK & TRADING SCENARIOS
Bullish Scenario
A bounce from 1.3548 or 1.3528, accompanied by RSI turning upward and price reclaiming 1.3580, could trigger a recovery back toward 1.3592 and potentially 1.3632. This would require strong volume and bullish candlestick confirmation.
Neutral Scenario
Sideways movement between 1.3548 and 1.3580 may result in a short-term consolidation zone. RSI ranging between 40–50 would reflect indecision, favoring range-bound setups before the next impulse.
Bearish Scenario
A decisive breakdown below 1.3528 would confirm continuation of the bearish trend. Next targets would be 1.3500 and 1.3446. RSI dipping below 35 would further validate this scenario.
💼 TRADING CONSIDERATIONS
Bullish setup: Monitor for bullish reversal candles at 1.3548 or 1.3528. Potential targets are 1.3580 and 1.3592, with stops placed under 1.3500.
Bearish setup: Consider short entries on a confirmed breakdown below 1.3528, targeting 1.3500 and 1.3446. Failed retests of 1.3580 may offer secondary entries.
Risk context: Volatility is likely to rise near these Fibonacci levels. Use structured stops and monitor RSI confirmation to validate trade bias.
🏁 CONCLUSION
GBP/USD has broken a key structural support at 1.3580, with price slipping below both key moving averages and RSI pointing lower. The next reaction zone lies near 1.3548–1.3528. A failure to bounce at these levels could deepen the retracement toward 1.3446. Unless bulls reclaim lost ground above 1.3580, downside pressure remains dominant in the short term.
⚠️ DISCLAIMER
This analysis is for informational purposes only and does not constitute financial advice. Always consult with a licensed financial professional before making trading decisions.


