
📊 MARKET OVERVIEW
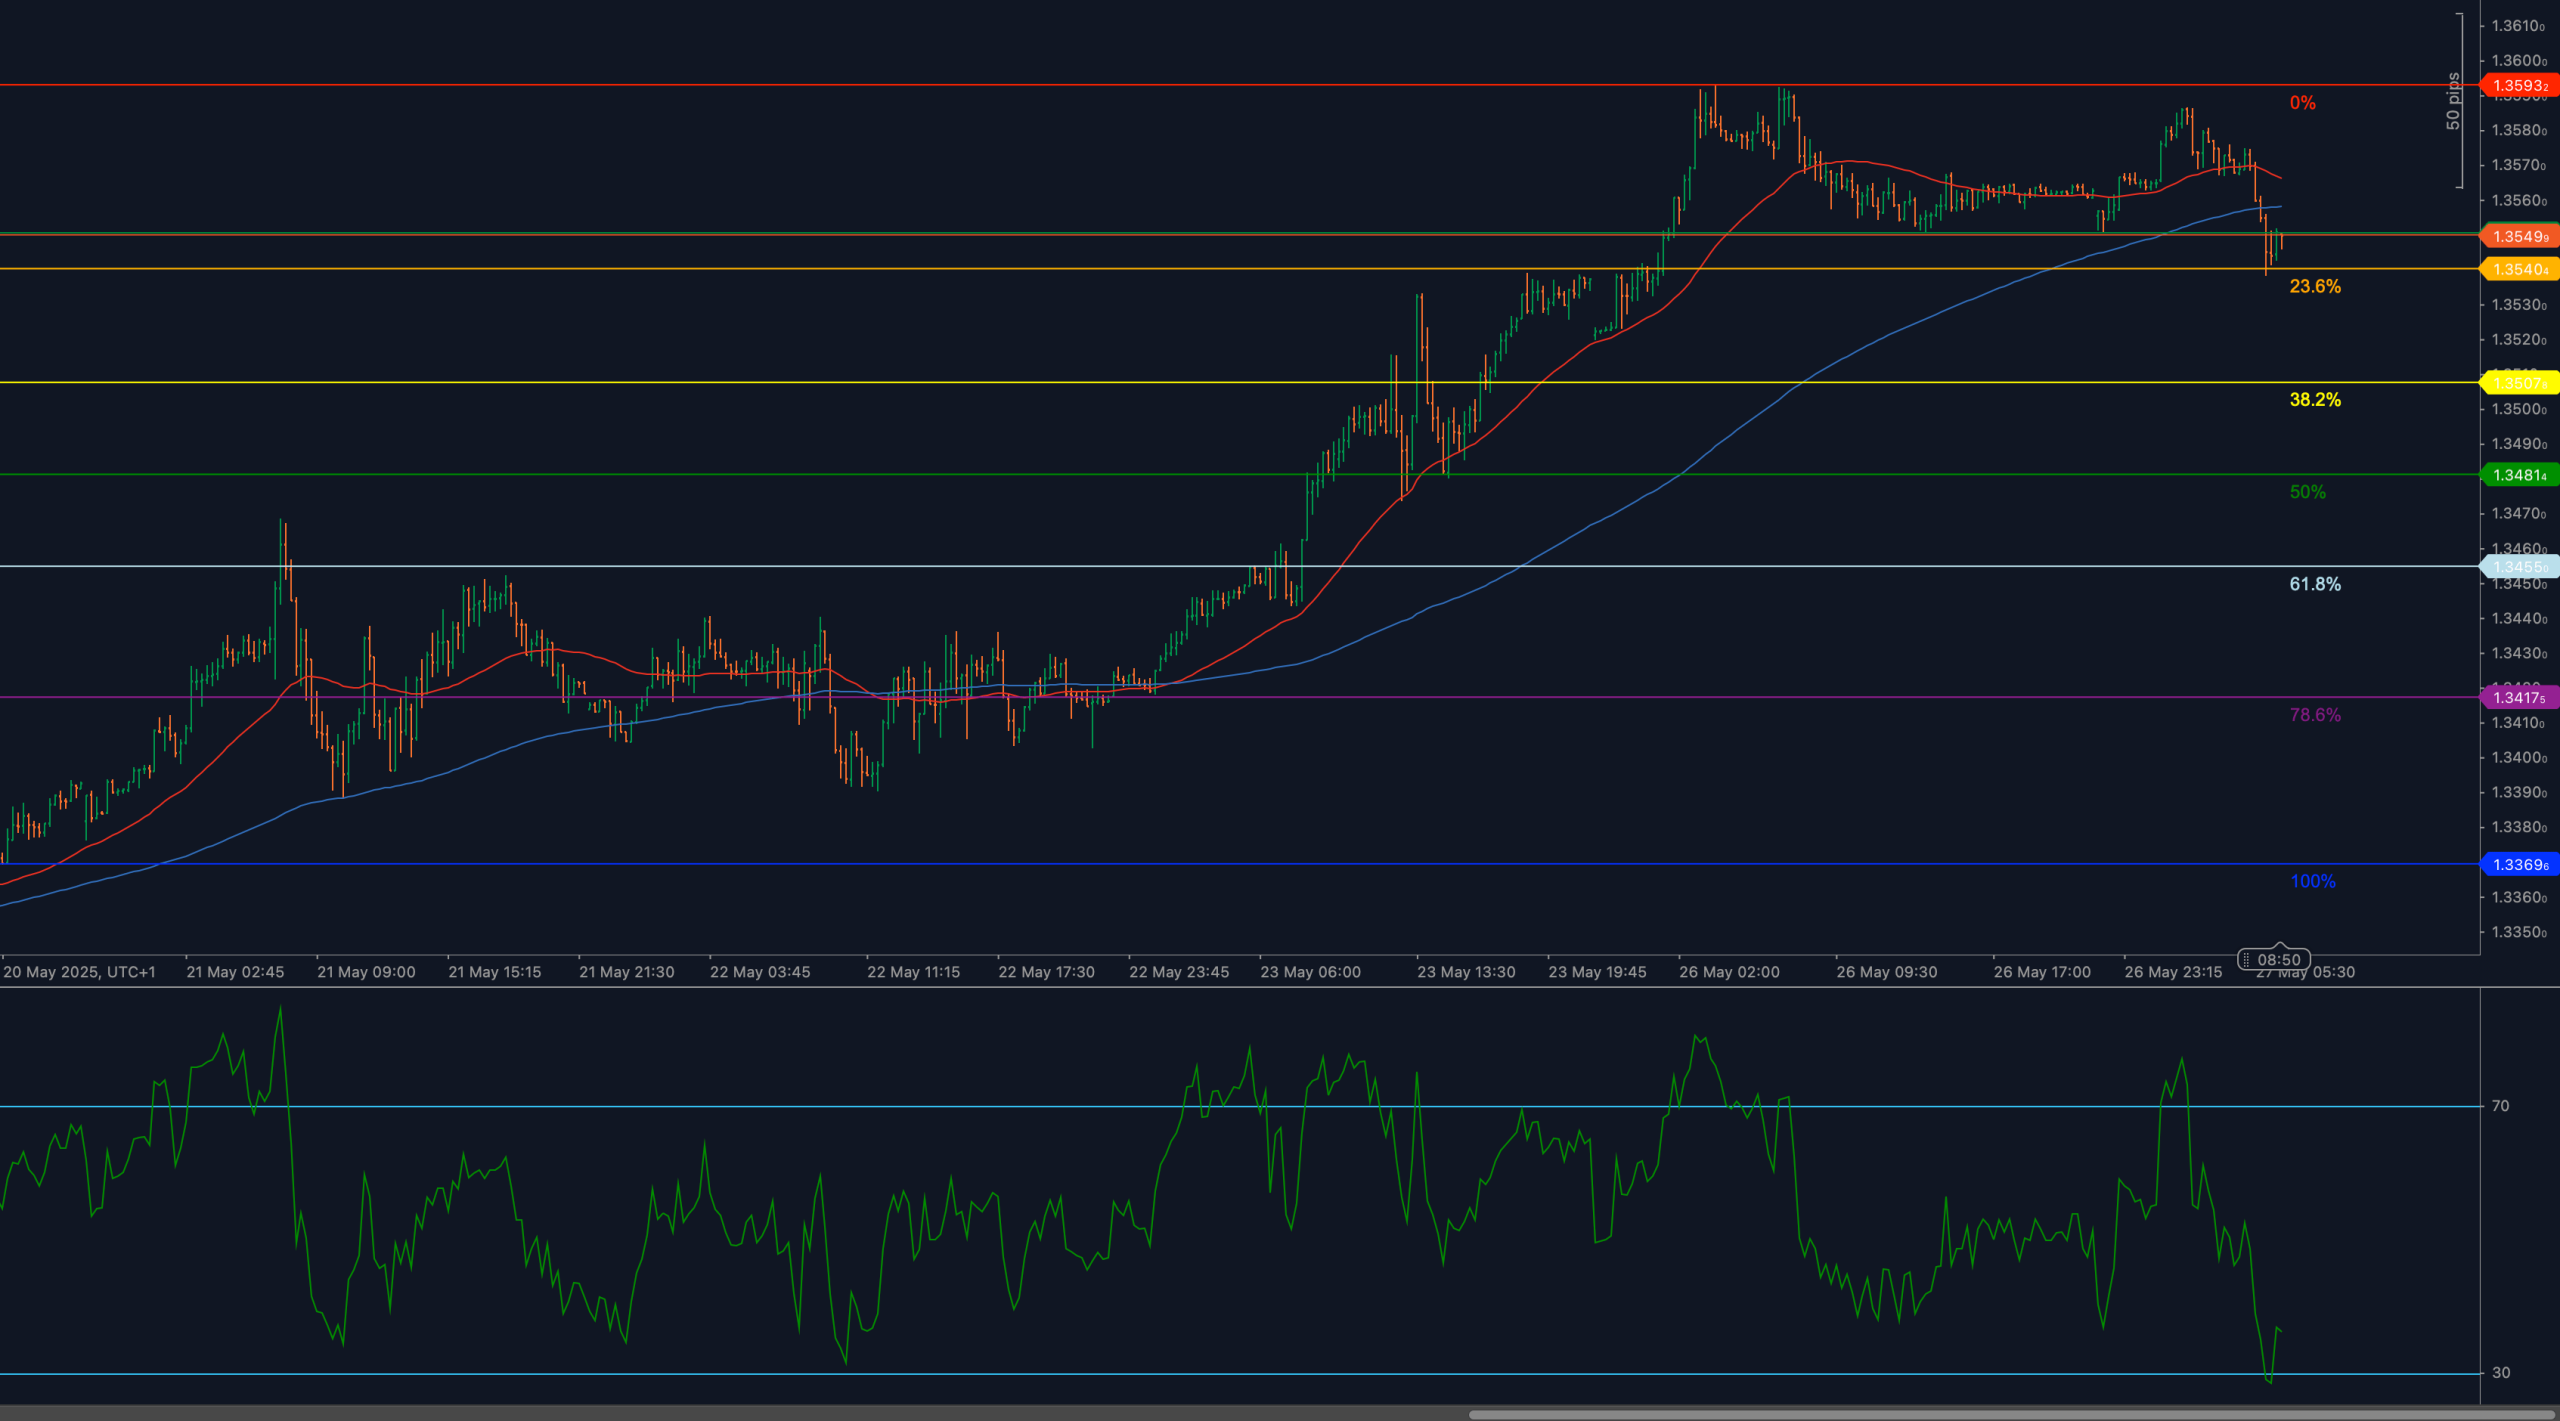
GBP/USD has transitioned from bullish extension into corrective territory after a failed attempt to break above 1.3595. The pair has now declined below 1.3549, which previously served as breakout support, and is testing the 23.6% Fibonacci retracement at 1.3504. This marks a clear structural shift from impulsive upside to reactive consolidation, as bulls begin to lose technical control.
The move lower is also compounded by RSI plunging sharply from overbought — a signal that upward momentum has not only stalled but may have fully reversed in the short term. Traders are now turning their attention to deeper retracement zones, including 1.3481 (38.2%) and 1.3450 (50%), which represent critical tests for trend preservation.
📈 TECHNICAL ANALYSIS
Key Support and Resistance Levels
Former resistance at 1.3549 has now flipped to a key resistance level. Price failed to hold above this zone after spiking into 1.3595, which now marks the top of the current structure. A sustained recovery above 1.3549 would be needed to regain bullish momentum and initiate a new attempt toward 1.3595–1.3610.
To the downside, the first line of defense is the 23.6% Fibonacci retracement at 1.3504 — a level currently under pressure. A break below this exposes the 38.2% retracement at 1.3481, followed closely by 1.3450, the 50% midpoint retracement of the May rally. These zones often serve as stabilizing points for medium-term trends, and a reaction here could provide the next direction cue.
Failure to find support within this zone, however, would be a strong indication that the entire bullish sequence is being unwound.
Moving Averages and Dynamic Price Action
GBP/USD has broken below the 50-period weighted moving average, which was acting as dynamic support near 1.3555, and is now hovering just above the 200-WMA, located around 1.3510. This confluence zone had supported the pair during recent retracements, but is now vulnerable to violation as momentum shifts lower.
Should price fail to reclaim these averages quickly, their slope may begin to flatten or roll over — adding to downside pressure. If the 200-WMA breaks decisively, it would signal a broader trend deterioration, increasing the probability of deeper corrective extension toward the 61.8% Fibonacci region.
RSI Momentum and Bearish Pressure
The 14-period RSI has reversed sharply from overbought levels above 70, and is now plunging toward the 30 threshold, reflecting a dramatic shift in short-term momentum. This confirms that bullish control has faded and that selling pressure is no longer just profit-taking — it’s structural.
If RSI crosses into oversold territory and remains there without divergence or support bounce, the current selloff may gain additional strength. In contrast, a higher low in RSI versus price could mark a short-term bottom — but there is no evidence of that yet.
Candlestick Behavior and Price Action Clarity
Recent candles show increasing bearish body size with strong closes near session lows. The transition from long upper shadows to clean downside follow-through illustrates growing confidence from sellers. The failure of 1.3549 was especially important — price did not consolidate or hold at that zone, but instead accelerated lower.
Unless a bullish engulfing or strong pin bar appears near 1.3481–1.3450, the technical setup favors continued selling into the next support levels.
Chart Structure and Breakdown Formation
The broader price structure shows a textbook impulse leg followed by a topping phase and now an unfolding correction. The loss of 1.3549 confirms the end of the previous bullish sequence, and the aggressive decline suggests the current move is not just a dip — it is a reversal leg within a corrective cycle.
The sequence now resembles a rounded top formation, with price slipping below moving averages and retracement thresholds. If no sharp reversal occurs at current levels, the market could begin targeting the 1.3450–1.3425consolidation band from earlier in the week.
Fibonacci Retracement and Extension Levels
The Fibonacci retracement drawn from 1.3369 (May 21 low) to 1.3595 (May 23 high) shows that price has now entered the correction phase. The 23.6% retracement at 1.3504 is under threat, and a break below that level exposes the 38.2% retracement at 1.3481, which is often considered the “true support” in bullish structures.
A further decline would bring the 50% retracement at 1.3450 into focus, followed by the 61.8% retracement at 1.3425, where longer-term traders may re-engage. Full retracement would bring the pair back to 1.3369, effectively wiping out the recent rally and forcing a complete trend reassessment.
To resume upside, bulls must reclaim 1.3549, break through 1.3595, and invalidate the current structure with momentum and volume.
🔍 MARKET OUTLOOK & TRADING SCENARIOS
Bullish Scenario
If price finds support near 1.3504 and rebounds sharply, bulls could stage a recovery toward 1.3549. A close above this level, supported by RSI rising back through 50, would shift structure back toward upside targets at 1.3595–1.3610.
Neutral Scenario
Sideways action between 1.3504–1.3549, with RSI ranging between 40–50, would suggest indecision and base-building. This could lead to either reversal or breakdown, depending on which side reclaims momentum.
Bearish Scenario
A breakdown below 1.3504, confirmed with RSI holding below 40, would target 1.3481, 1.3450, and possibly 1.3425. A close below 1.3450 would invalidate the prior rally leg and suggest further downside ahead.
💼 TRADING CONSIDERATIONS
Bearish bias is favored beneath 1.3549, especially on pullback rejections and breakdown confirmation. Aggressive sellers may initiate shorts on break of 1.3504, with scaling opportunities down to 1.3450. Bulls must await reclaim of 1.3549 and rising RSI for reversal setups.
🏁 CONCLUSION
GBP/USD has lost key support at 1.3549, slipping into the 1.3504 retracement zone with RSI collapsing from overbought. Structure has shifted from bullish continuation to active correction. Unless price reclaims lost ground quickly, further downside toward 1.3481, 1.3450, and even 1.3425 is the more probable outcome.
⚠️ DISCLAIMER
This analysis is for informational purposes only and does not constitute financial advice. Always consult with a licensed financial professional before making trading decisions.


