
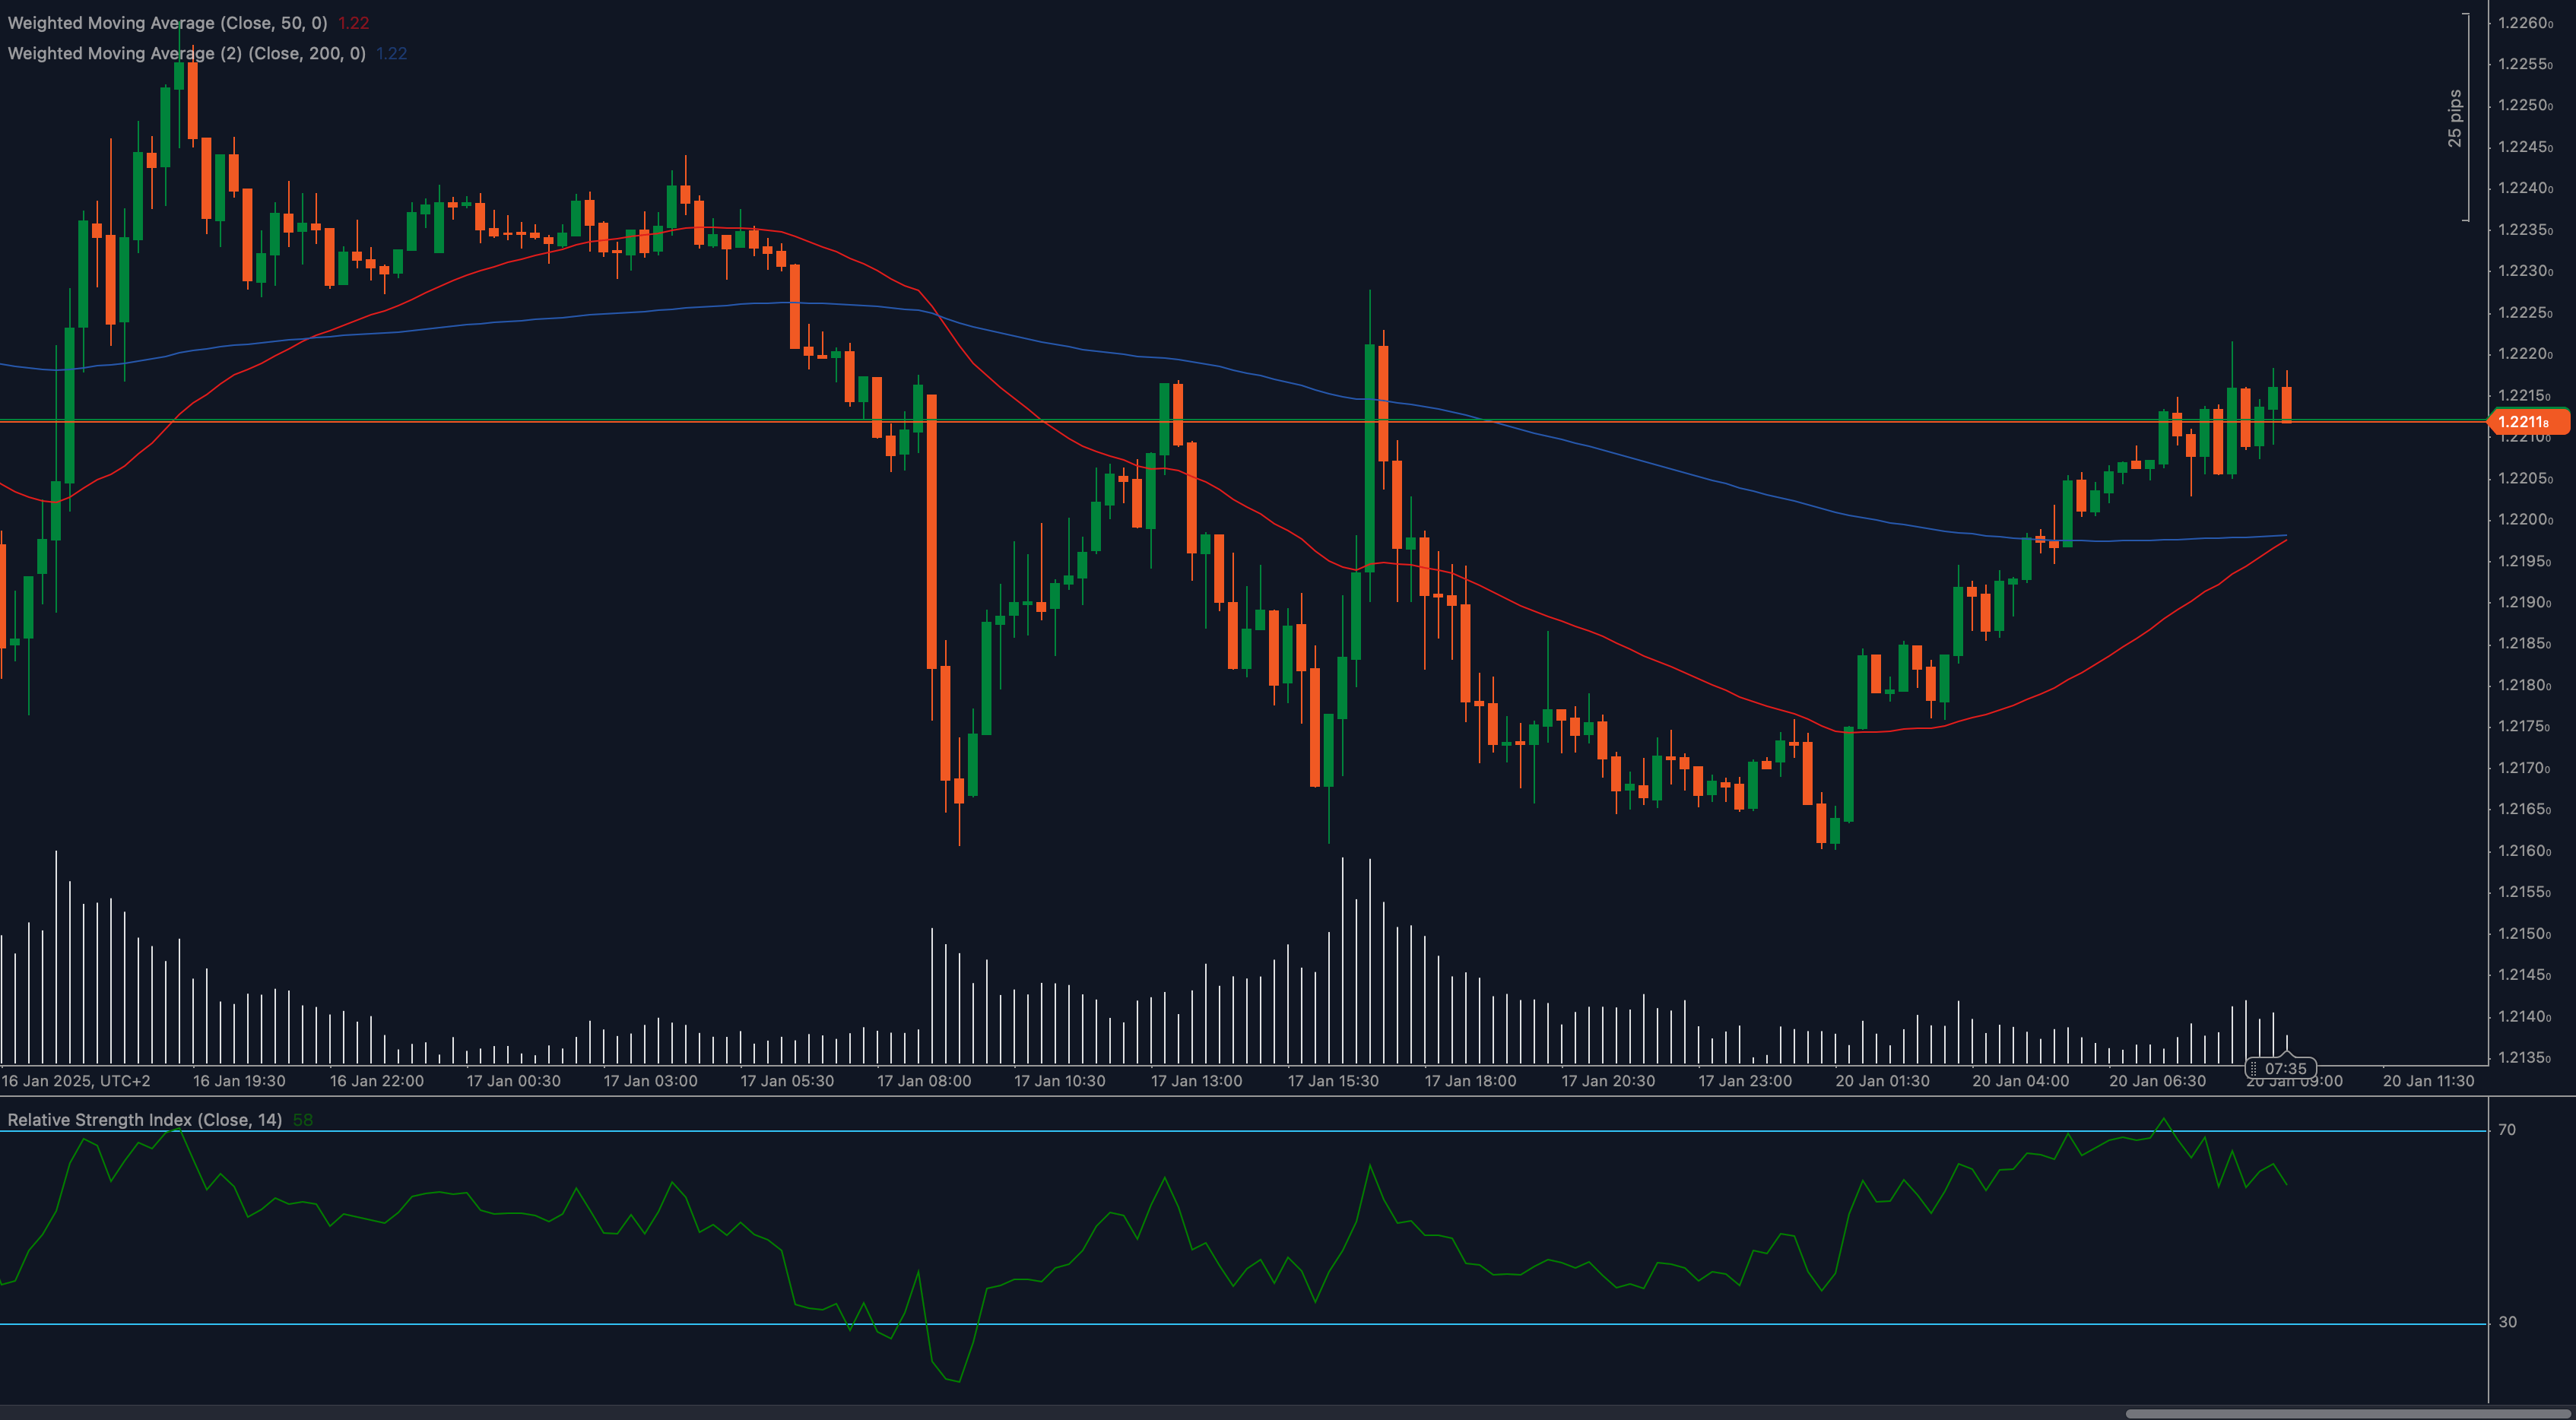
The GBP/USD pair is testing a key 1.2211 resistance level, signaling a critical juncture for the bulls. The pound has been recovering steadily, supported by moderate momentum, but the test at this resistance zone could define the pair’s next move.
📈 Moving averages highlight mixed signals. The 50 Weighted Moving Average (WMA) is rising, reflecting recent bullish momentum, but the 200 WMA remains above the current price, acting as a strong resistance barrier. A successful breakout above 1.2211 could pave the way for further gains toward 1.2235, but failure to hold above this level might trigger a pullback toward the 1.2180 support zone.
📊 RSI shows moderate bullish momentum. The Relative Strength Index (RSI) is currently at 58, signaling that bullish momentum is present but not yet overwhelming. If RSI crosses 60, it would confirm stronger momentum, supporting a breakout. On the downside, RSI moving below 50 would increase the likelihood of a bearish retracement.
🔎 Key levels to watch:
- Support: 1.2180 (short-term), 1.2160 (major level)
- Resistance: 1.2211 (current test), 1.2235 (next breakout target)
💡 Fundamental drivers add complexity. The pound’s movement is influenced by mixed economic signals, including soft UK retail sales data and ongoing uncertainty about the Bank of England’s next moves. On the US side, Federal Reserve commentary and US Dollar strength continue to play a pivotal role. Traders should watch upcoming economic reports and central bank remarks for directional clues.
🌍 The 1.2211 resistance is a critical test. A breakout could signal a continuation toward 1.2235, while rejection at this level might lead to a retracement back to the 1.2180 support zone. Let’s see how the market reacts in the next session!


