
📊 MARKET OVERVIEW
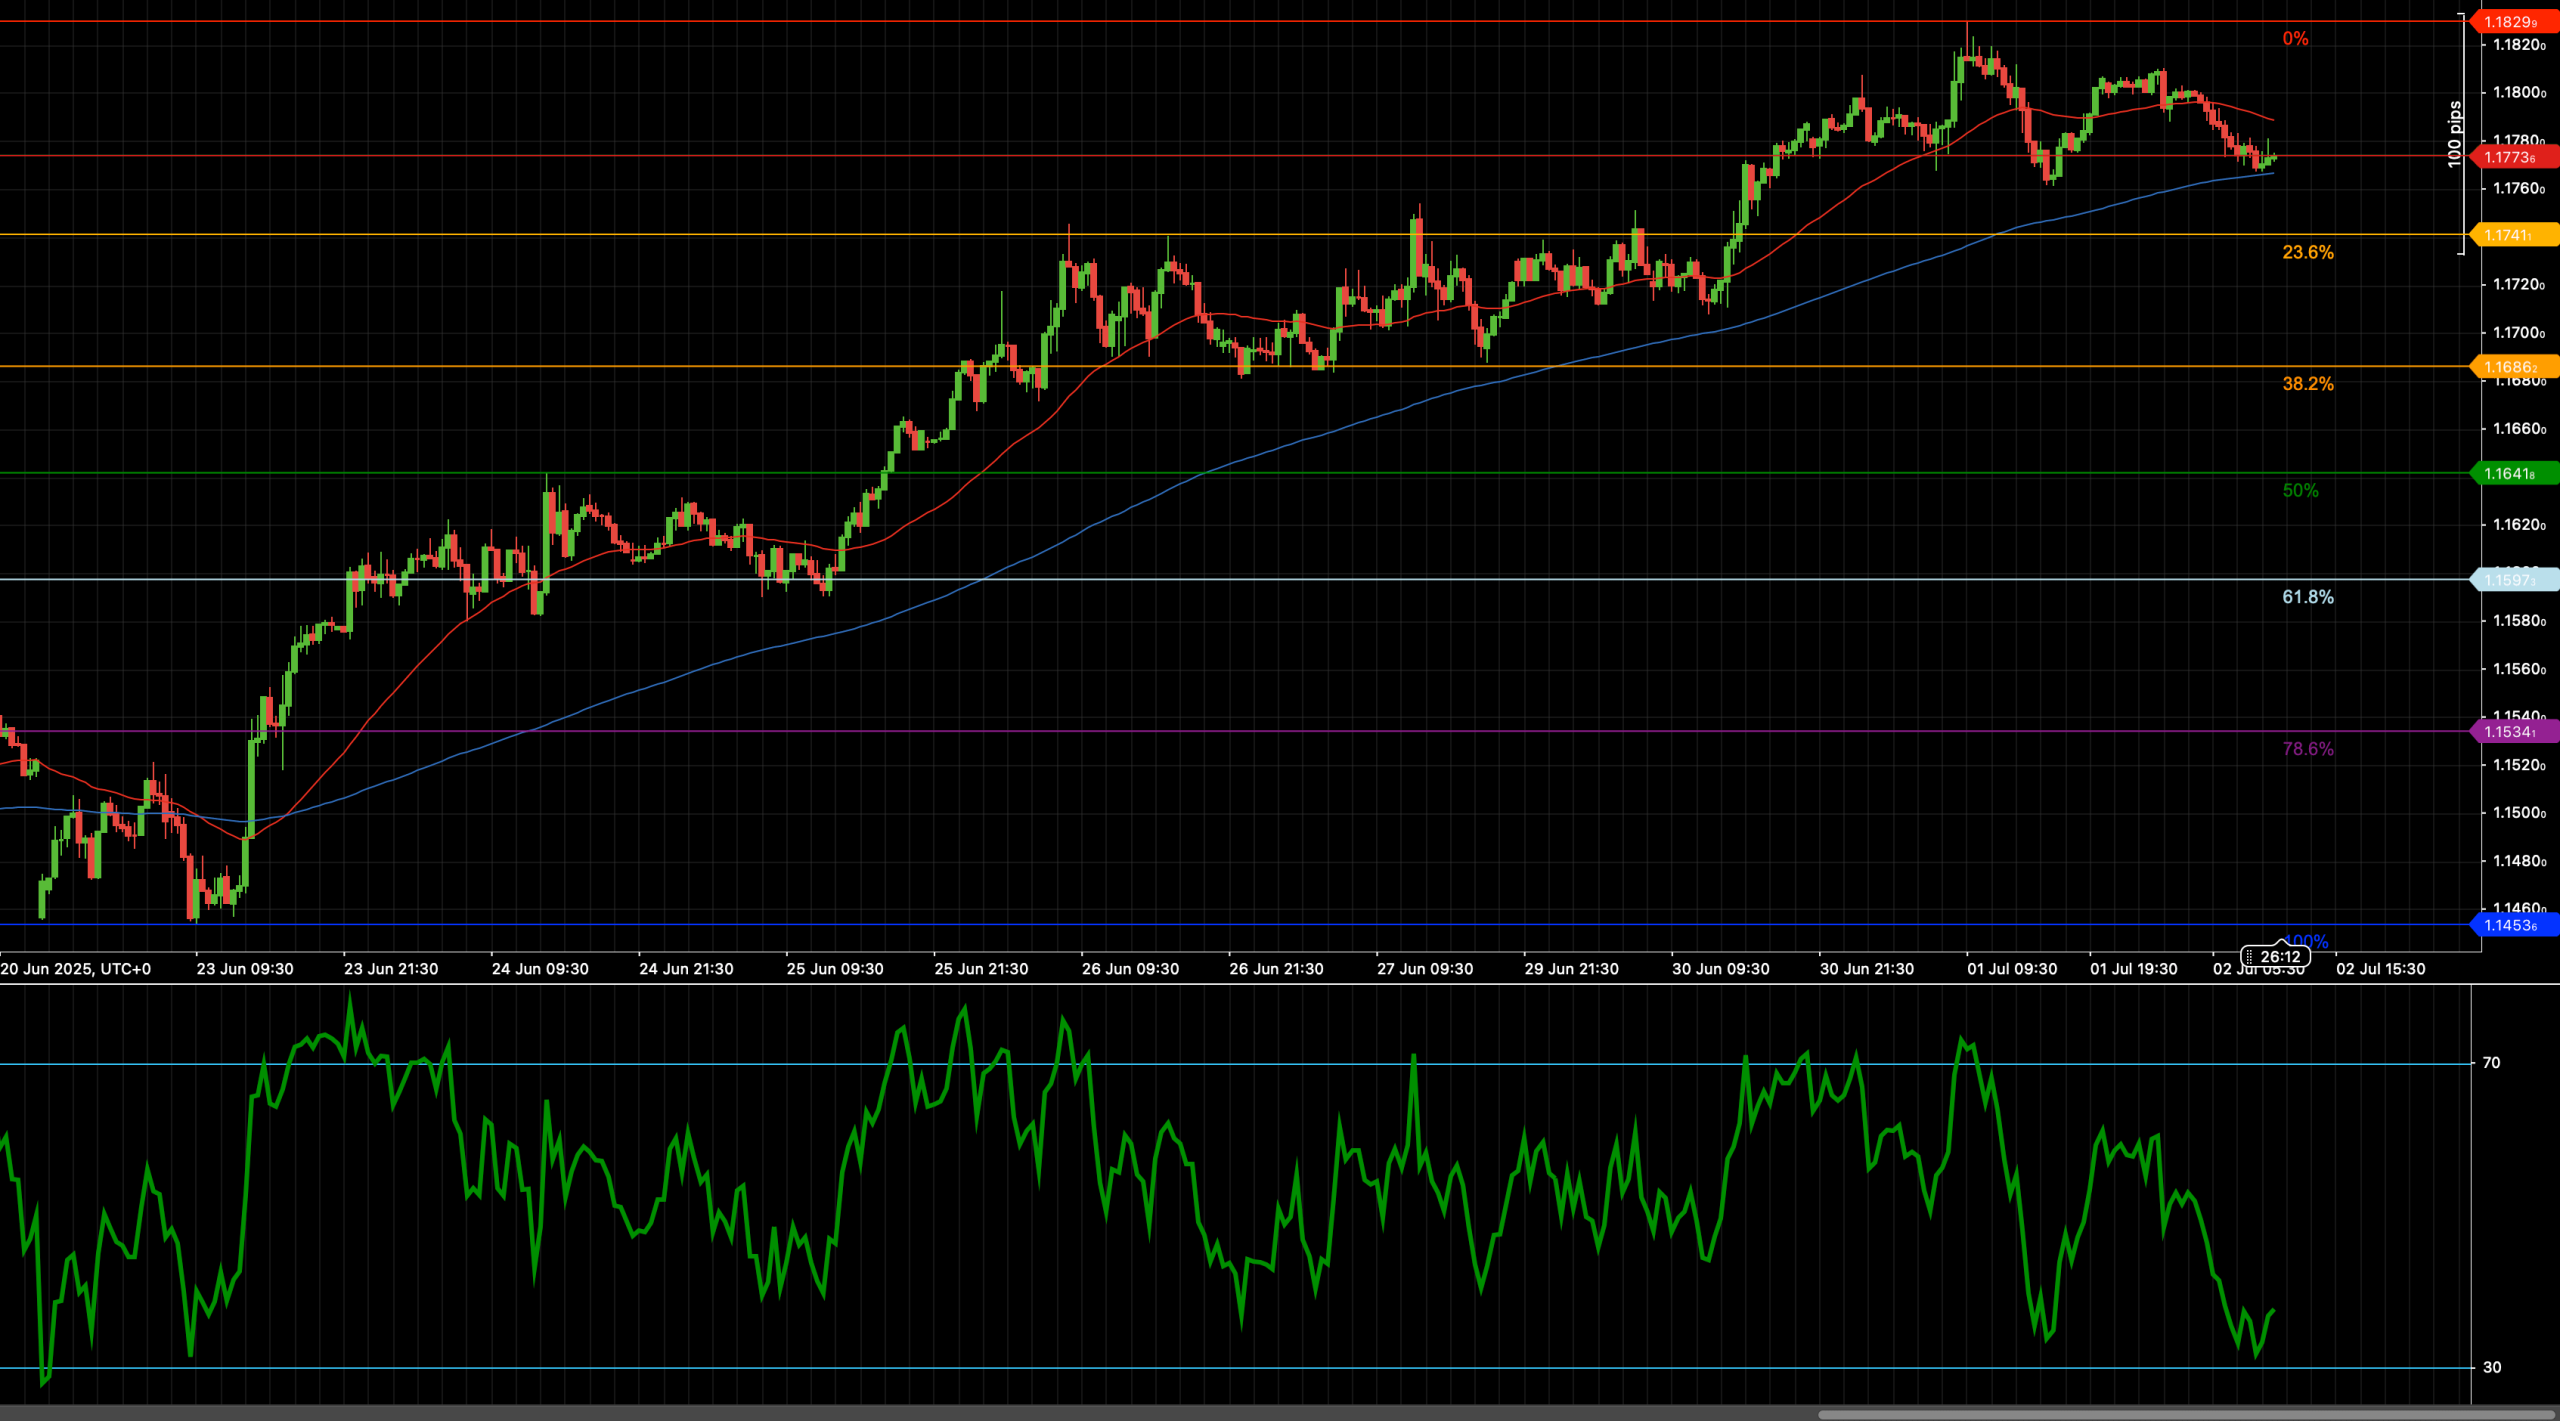
EUR/USD continues to hold in a tight consolidation phase after reaching 1.1829 earlier this week, with price action now hovering just above the 1.1770 zone — the 23.6% Fibonacci retracement of the June advance. This level also coincides with the rising 200-period weighted moving average, acting as dynamic support for the prevailing bullish structure.
Recent price action suggests a pause in bullish momentum rather than a reversal. The lack of follow-through on selling pressure, combined with resilience at key support, implies that bulls still have the upper hand — especially while fundamentals such as ECB-Fed rate differentials lean mildly in favor of the euro. Traders now await confirmation through volume and momentum indicators for the next leg higher or signs of breakdown below 1.1770.
📈 TECHNICAL ANALYSIS
Key Support and Resistance Levels
The key short-term support sits at 1.1770, which aligns with both the 23.6% Fibonacci retracement and the 200-WMA. A failure to hold this level could expose the next support cluster around 1.1740, followed by deeper downside potential near the 38.2% retracement at 1.1686.
On the upside, resistance stands firm at 1.1825 — the recent high — followed by 1.1850 and 1.1880. A confirmed breakout above these levels would mark a continuation of the medium-term bullish trend and potentially aim for 1.1920.
Moving Averages and Price Dynamics
EUR/USD remains above both its 50- and 200-period WMAs, with the moving averages steadily rising. The 50-WMA continues to slope positively and recently provided a springboard for bullish momentum near 1.1735. The confluence of price and moving averages suggests that the current consolidation may be a shallow pullback within a broader uptrend, with dynamic support zones reinforcing bullish conviction.
RSI Momentum and Trend Strength
The 14-period RSI has cooled off from its recent overbought levels but continues to print above the neutral 50 mark, indicating that bullish momentum is still active, albeit less aggressive. Previous support for RSI has emerged near 42-45, and any move below that would raise the probability of a deeper correction. A fresh RSI bounce above 55–60 would likely precede a breakout toward 1.1850+ targets.
Candlestick Structure and Market Tone
Recent candlestick patterns show tight-bodied candles and smaller wicks, reflecting consolidation after a strong directional impulse. The lack of wide-bodied bearish candles and multiple dojis near the 1.1770 area reinforce the idea of buyer interest at this zone. For directional confirmation, traders should monitor for a bullish engulfing or impulsive close above 1.1825.
Chart Structure and Trend Integrity
The broader price structure on EUR/USD continues to reflect a healthy uptrend: higher highs, higher lows, and supported by moving averages. The current base around 1.1770 represents a typical consolidation phase following a sharp rally, and unless a breakdown occurs below 1.1740, the technical bias remains skewed toward the upside.
Fibonacci Roadmap and Target Zones
The current Fibonacci framework is drawn from the June swing low to the recent 1.1829 peak. Price has respected the 23.6% level at 1.1771 and shows limited pressure to test deeper levels. A break above 1.1825 would open 1.1850 (near-term extension) and 1.1880 (upper Fib expansion). Conversely, a break below 1.1740 would activate 1.1686 and 1.1620 Fibonacci retracement targets.
🔍 MARKET OUTLOOK & TRADING SCENARIOS
Bullish Scenario
A sustained close above 1.1825 with RSI firming above 60 would signal breakout continuation. Target zones include 1.1850 and 1.1880, with bullish confirmation strengthened by price holding above the 50-WMA.
Neutral Scenario
Sideways drift between 1.1740 and 1.1825 would keep EUR/USD in consolidation mode. RSI likely remains between 45 and 60. Mean-reversion strategies and range-bound positioning could apply short-term.
Bearish Scenario
A break and daily close below 1.1740, coupled with RSI falling under 45, would open deeper downside risks toward 1.1686 and possibly 1.1620. This would signal a structural shift toward a corrective phase.
💼 TRADING CONSIDERATIONS
- Bullish setup: Buy above 1.1825, targeting 1.1850 and 1.1880. Stop loss below 1.1740
- Bearish setup: Sell breakdown below 1.1740, targeting 1.1686 and 1.1620. Stop above 1.1825
- In range: Fade both ends of the 1.1740–1.1825 channel with tight stops and momentum confirmation
🏁 CONCLUSION
EUR/USD is currently digesting its recent gains in a healthy consolidation above 1.1770 support. With price structure, RSI, and moving averages all pointing to continued bullish potential, the focus remains on 1.1825 as the breakout level to confirm trend continuation. A drop below 1.1740 would alter the near-term picture, but for now, bulls remain in control.
⚠️ DISCLAIMER
This analysis is for informational purposes only and does not constitute financial advice. Always consult a licensed financial advisor before making investment decisions.


