
📊 Market Overview
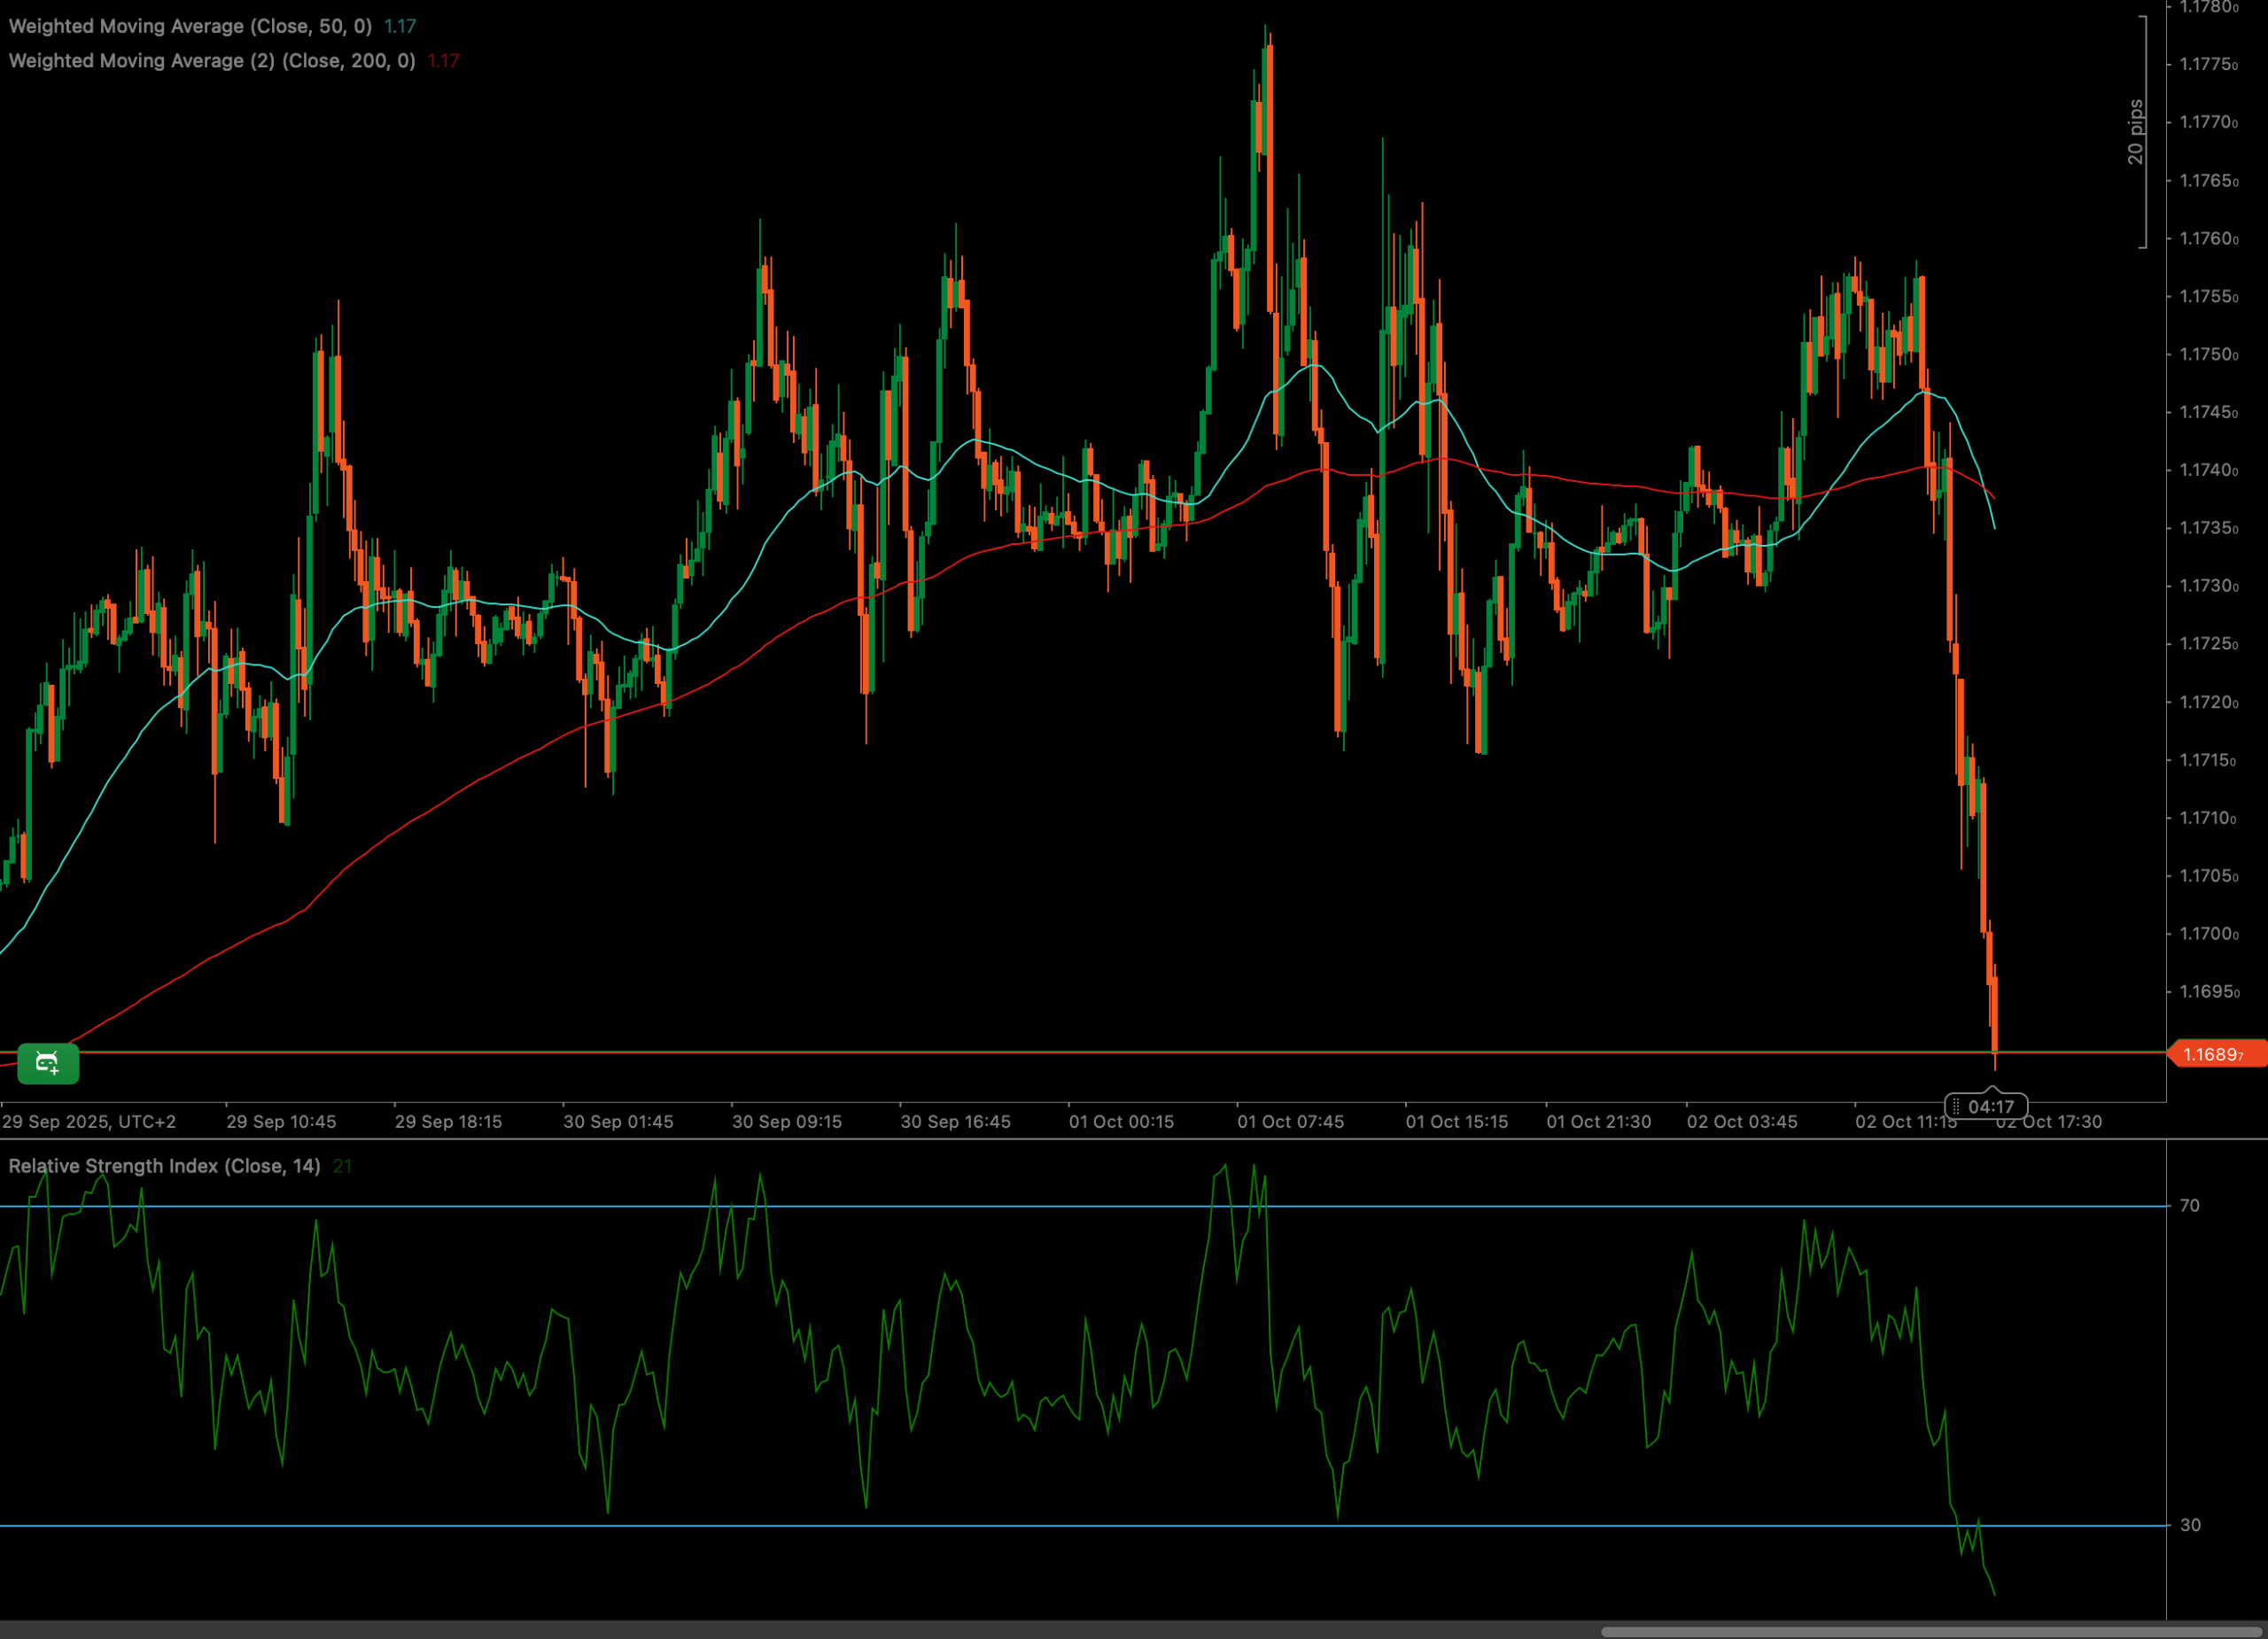
The EURUSD currency pair has undergone a dramatic reversal, culminating in a sharp sell-off. After a period of choppy, upward-trending price action that established highs near the 1.1780 level, sellers took decisive control. The market experienced a significant breakdown on October 2nd, with the price plummeting through multiple technical support levels in a very short period.
This abrupt shift in sentiment has erased recent gains and positioned the pair at a critical juncture. The price action suggests a fundamental change in market dynamics, moving from a cautiously optimistic tone to one dominated by strong bearish momentum. The current price is resting at the lows of this recent plunge, testing the market’s appetite for further downside.
📈 Technical Analysis
Key Support and Resistance Levels
Following the sharp decline, the immediate support for the EURUSD is the recent low established around 1.1690. A breach of this level would confirm the continuation of the bearish trend. Conversely, the broken support levels have now turned into formidable resistance. The 200-period WMA around 1.1740 and the 50-period WMA near 1.1730 now serve as the first major hurdles for any potential recovery. The prior peak around 1.1780 remains the key long-term resistance.
Moving Average Analysis for EURUSD
The moving averages paint a clear picture of the trend reversal. For most of the period shown, the price remained above both the 50 WMA (cyan line) and the 200 WMA (red line), with the 50 WMA trading above the 200 WMA, indicating a bullish structure. However, the sell-off on October 2nd caused the price to slice through both averages decisively. This action is a strong bearish signal, and the 50 WMA is now pointing sharply downwards, poised to cross below the 200 WMA, which would form a bearish ‘death cross’ on this timeframe.
RSI and Momentum Shift in EURUSD
The Relative Strength Index (RSI) dramatically illustrates the shift in momentum. Prior to the drop, the RSI flirted with the overbought 70 level, particularly as the price peaked near 1.1780. The subsequent sell-off sent the RSI plummeting. The chart shows the RSI has fallen to a value of 21, deep within the oversold territory (below 30). This extreme reading suggests the selling may have been over-extended in the short term, potentially leading to a minor bounce or consolidation. However, it primarily confirms the overwhelming bearish momentum.
Volume Spike and Market Participation
While specific volume data is not visible on this chart, a price drop of this magnitude and velocity is almost certainly accompanied by a significant spike in selling volume. This would confirm strong conviction from sellers and suggest a capitulation event. Traders should cross-reference this price action with volume indicators on their own platforms to validate the strength of this bearish breakdown.
Candlestick Tone and Market Reaction for EURUSD
The candlestick patterns leading into the final hours of the chart are unequivocally bearish. The price action on October 2nd is dominated by several large, consecutive orange (bearish) candles with very small lower wicks, indicating that sellers were in complete control from open to close of each period. This pattern signifies intense selling pressure and a lack of buying interest, even at lower prices, reinforcing the strength of the new downtrend.
🔍 Market Outlook & Trading Scenarios
Bullish Scenario
Given the deeply oversold RSI reading (21), a counter-trend bounce is possible. If buyers step in at the 1.1690 support, a relief rally could target the 50 WMA around 1.1730 as initial resistance. This remains a low-probability scenario without a clear bottoming pattern.
Neutral Scenario
The EURUSD may enter a period of tight consolidation around the 1.1690 low as the market digests the violent move. Sideways action between 1.1690 and 1.1710 could occur as traders await the next catalyst, with the RSI slowly moving out of oversold territory.
Bearish Scenario
This is the dominant scenario based on the technical breakdown. A failure to bounce convincingly from the 1.1690 level, or a weak rally that is rejected by the moving averages, would likely lead to another leg down. A sustained break below 1.1690 would confirm the continuation of the bearish trend, opening the door for further downside.
💼 Trading Considerations
- Bullish setup: A high-risk, counter-trend trade could be considered if a strong bullish reversal pattern (like a bullish engulfing candle) forms at the 1.1690 support, targeting the 50 WMA. Use tight stop-losses.
- Breakout setup: A definitive breakdown below the 1.1690 low on high volume would signal a short entry for trend-following traders.
- Bearish setup: Selling on any weak bounce towards the 50 and 200 WMAs could be a viable strategy, as these former supports are now expected to act as strong resistance.
🏁 Conclusion
The EURUSD has experienced a significant technical breakdown, shifting the market bias firmly to bearish. The price has crashed through the 50 and 200-period WMAs, which will now act as major resistance. While the RSI is deeply oversold and may prompt a short-term bounce, the overwhelming momentum is to the downside.
Traders should exercise caution. The path of least resistance appears to be lower, but the oversold conditions could create volatility. The reaction at the 1.1690 support level and the now-resistance moving averages will be critical in determining the next directional move for the EURUSD.
⚠️ Disclaimer
This analysis is for informational purposes only and does not constitute financial advice. Always consult a licensed financial advisor before making trading decisions.


