
📊 Market Overview
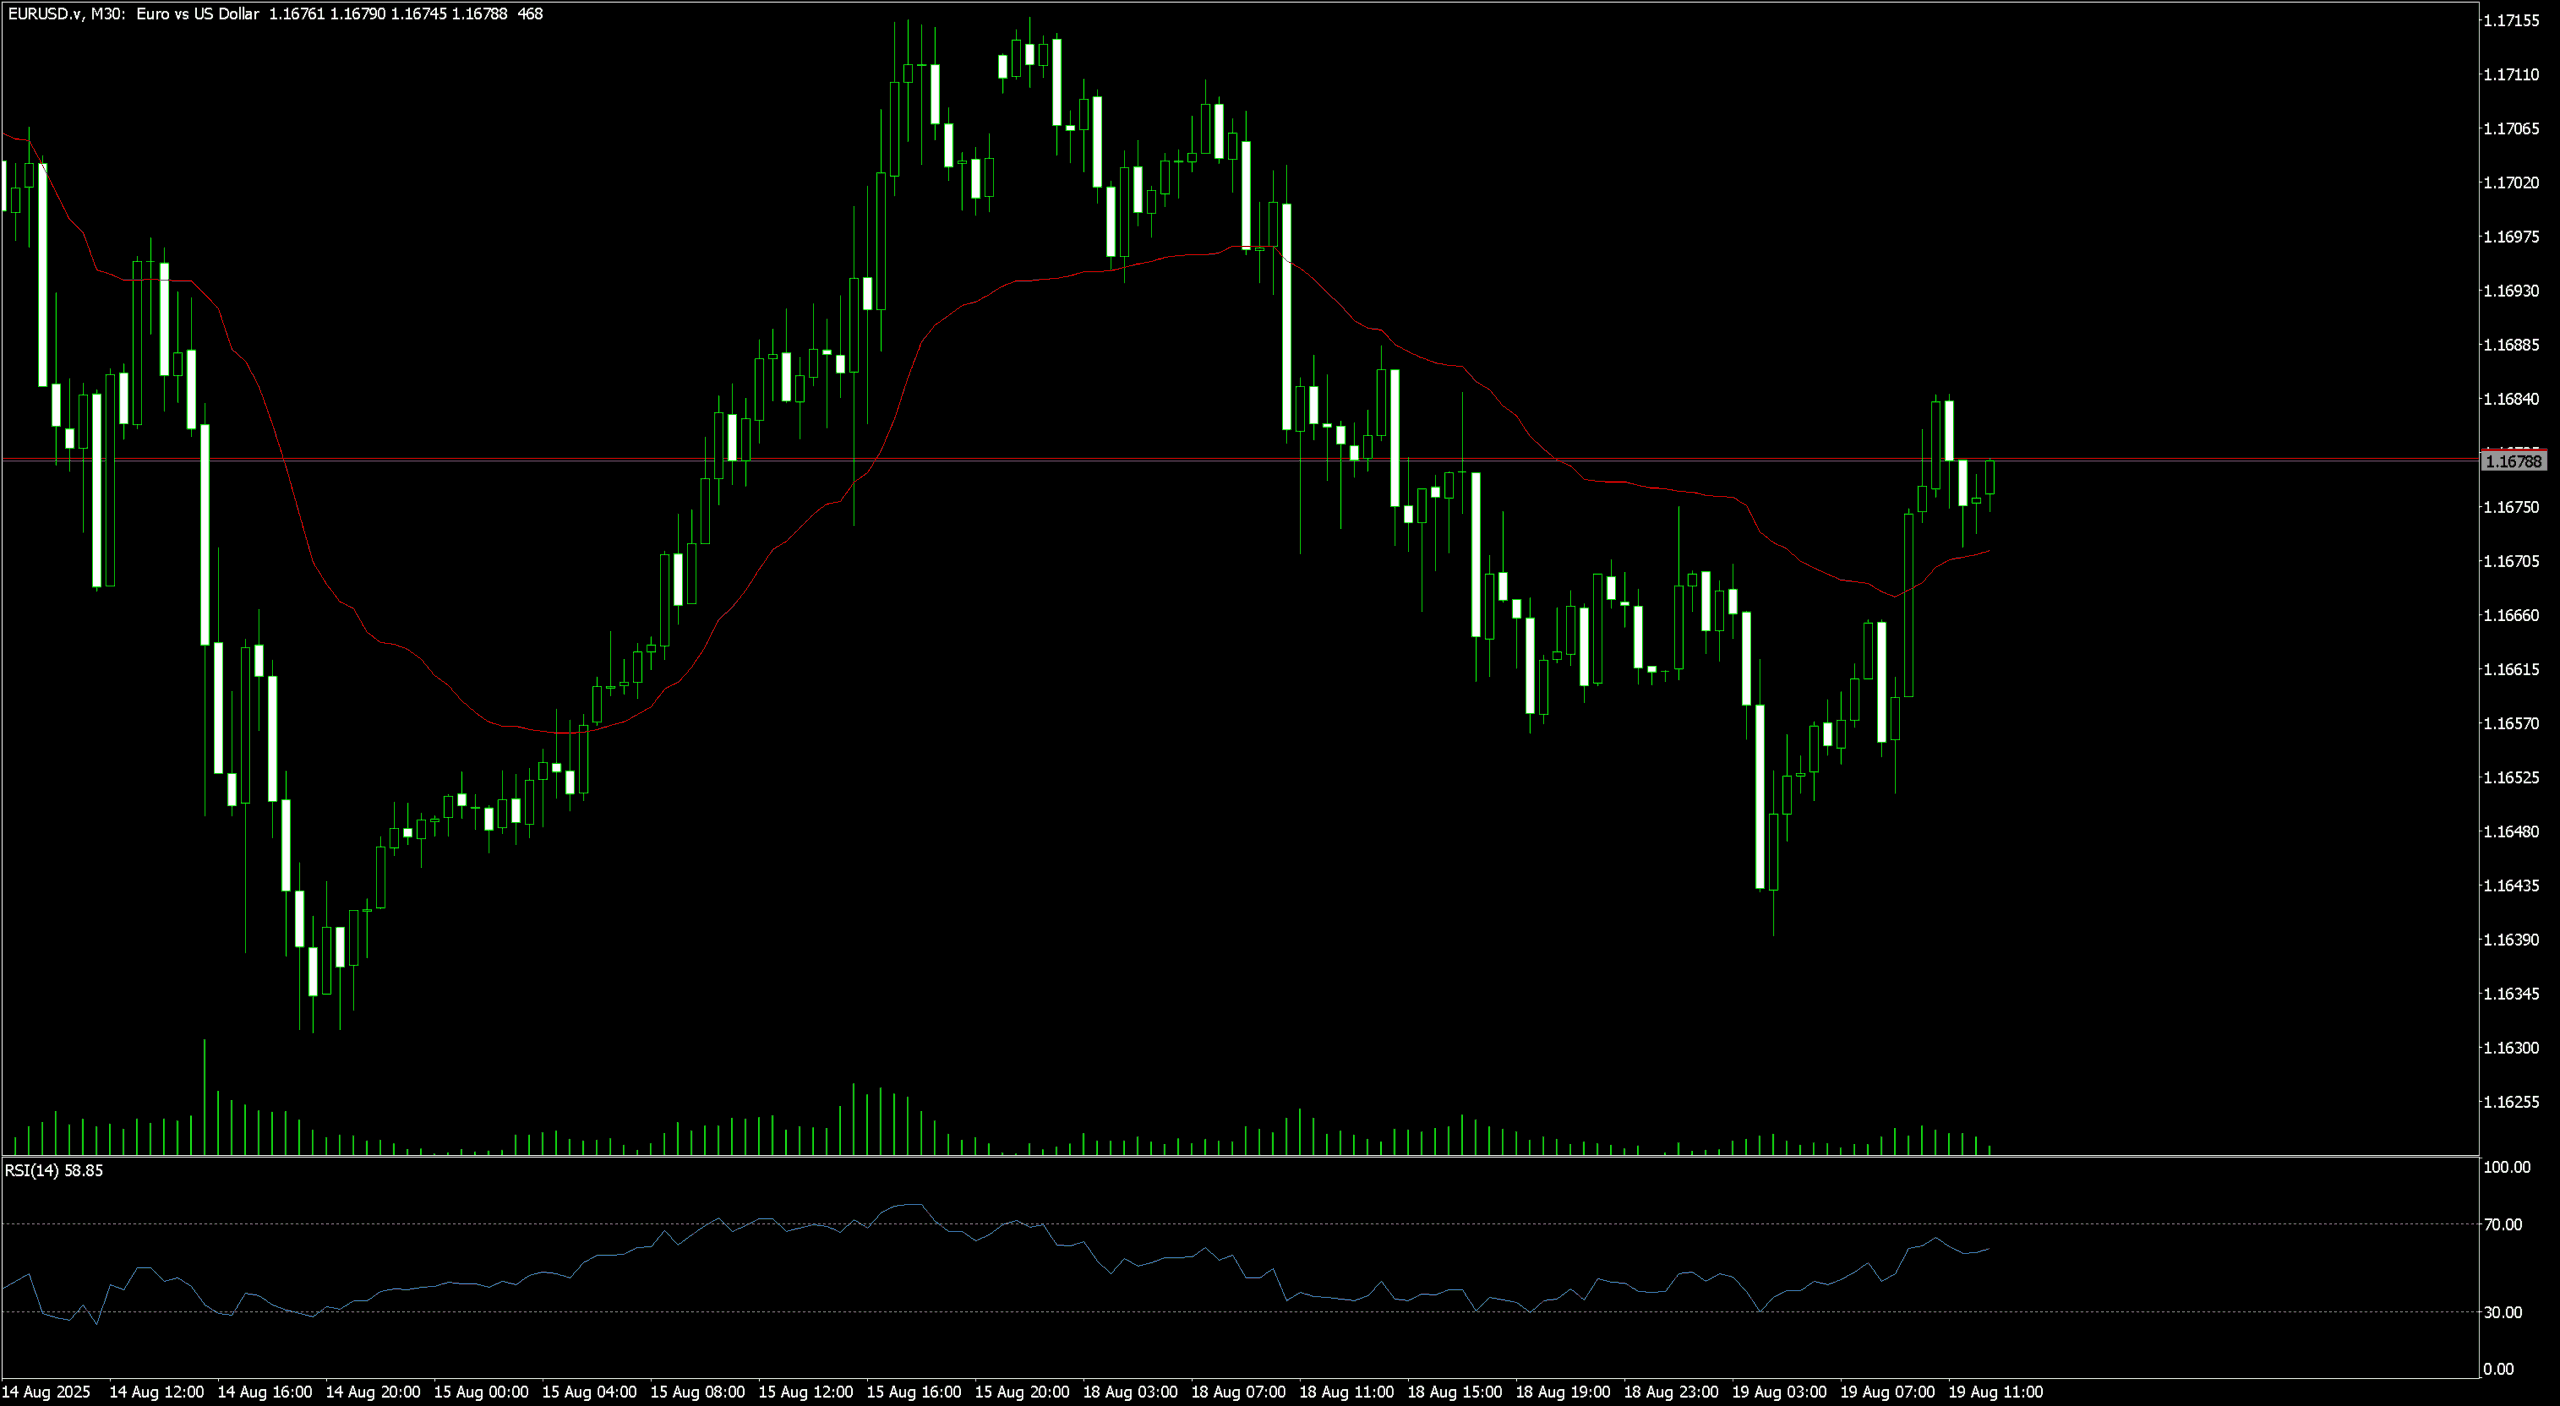
EUR/USD staged an impressive rebound after dipping to 1.1625 during the early hours of August 19. The pair found a firm footing at this support level and has since pushed higher, reclaiming ground above the 30-period exponential moving average (EMA) on the M30 timeframe. This move marks a technical shift in momentum, especially with rising volume and a bullish RSI trajectory.
The reversal follows a multi-day decline from the 1.1710 region, where sellers had previously gained control. With price now nearing the 1.1685 mark, bulls appear to be regaining short-term control, supported by momentum and a strong bounce structure.
📈 Technical Analysis
Key Support and Resistance Levels
Support is confirmed at 1.1625, where the latest bullish move began. This level marks the base of the recent retracement and is now considered a pivot zone.
Immediate resistance lies at 1.1685, the current price ceiling, followed by the next significant barrier between 1.1700 and 1.1710, which corresponds to the last consolidation range and previous highs. A clean break above 1.1710 would open the path toward new August highs.
Moving Average Breakout
The 30-period EMA (red line) was decisively broken as price accelerated to the upside. This shift in structure is important on the M30 chart, as it signals an end to the short-term downtrend and reintroduces a potential bullish phase. As long as EUR/USD holds above this EMA, buyers retain momentum.
RSI and Momentum Shift
The Relative Strength Index (RSI) is currently hovering around 58.85, up from oversold levels seen during the earlier downtrend. While not overbought yet, the indicator confirms strong upward momentum, particularly if it breaks above the 60 mark. Continued RSI strength may precede a test of the next resistance levels.
Volume Spike and Market Participation
An increase in volume during the breakout above the EMA supports the validity of the move. This uptick in participation adds credibility to the rally and reduces the risk of a fakeout, provided volume stays elevated in the next few candles.
Candlestick Tone and Market Reaction
Bullish candlesticks dominate the recent structure, particularly the long-bodied green candles that followed the base at 1.1625. The price is now showing signs of a pause just below resistance, potentially forming a bullish flag or minor consolidation before continuation.
🔍 Market Outlook & Trading Scenarios
Bullish Scenario
Holding above 1.1665 keeps bulls in control, with upside continuation likely toward 1.1700 and the 1.1710 resistance zone. A breakout above 1.1710 could extend the rally to 1.1730 or higher.
Neutral Scenario
A sideways pattern between 1.1665 and 1.1685 may emerge if buying momentum stalls. RSI remaining between 55 and 60 would reflect consolidation, awaiting catalyst-driven direction.
Bearish Scenario
A return below 1.1660 would signal fading bullish pressure, targeting a re-test of 1.1640 and 1.1625 support. A break below 1.1625 would invalidate the bullish setup and expose 1.1600 as the next downside target.
💼 Trading Considerations
- Bullish setup: Buy on dips above 1.1665 with targets at 1.1700 and 1.1710. Stop loss just below 1.1655.
- Breakout setup: Buy breakout above 1.1710 with confirmation, aiming for 1.1730.
- Bearish setup: Sell if price breaks below 1.1660, targeting 1.1640 and 1.1625. Stop above 1.1675.
🏁 Conclusion
EUR/USD has reversed sharply from 1.1625 and is now testing the 1.1685 region with a bullish structure in place. The break above the 30-period EMA, alongside a rising RSI and supportive volume, signals that bulls are gaining ground. If momentum continues, a test of 1.1700–1.1710 is likely, with broader upside potential toward 1.1730. Failure to hold above 1.1660 would negate the setup and return the pair to defensive mode.
⚠️ Disclaimer
This analysis is for informational purposes only and does not constitute financial advice. Always consult a licensed financial advisor before making trading decisions.


