
📊 MARKET OVERVIEW
The EURUSD pair is currently experiencing significant bearish pressure after breaking below the critical 1.0900 support level. Looking at the chart, we can see a clear downtrend forming as prices continue to trade below both the 50-day and 200-day moving averages. This technical breakdown comes amid broader dollar strength, with the pair now testing lower support levels not seen since early March. Volume has increased during the recent selloff, suggesting strong conviction behind the downward move.
📈 TECHNICAL ANALYSIS
What Are the Key Support and Resistance Levels for EURUSD?
The EURUSD pair has decisively broken below the crucial 1.0900 psychological support level, which has now transformed into immediate resistance. This level had previously served as a floor for price action throughout mid-March. The next significant support zone appears around 1.0850, followed by 1.0820 if selling pressure continues. On the upside, resistance levels are now established at 1.0900 (previous support turned resistance), followed by 1.0950 where the 50-day moving average is currently hovering, and then 1.1000, which represents a major psychological level.
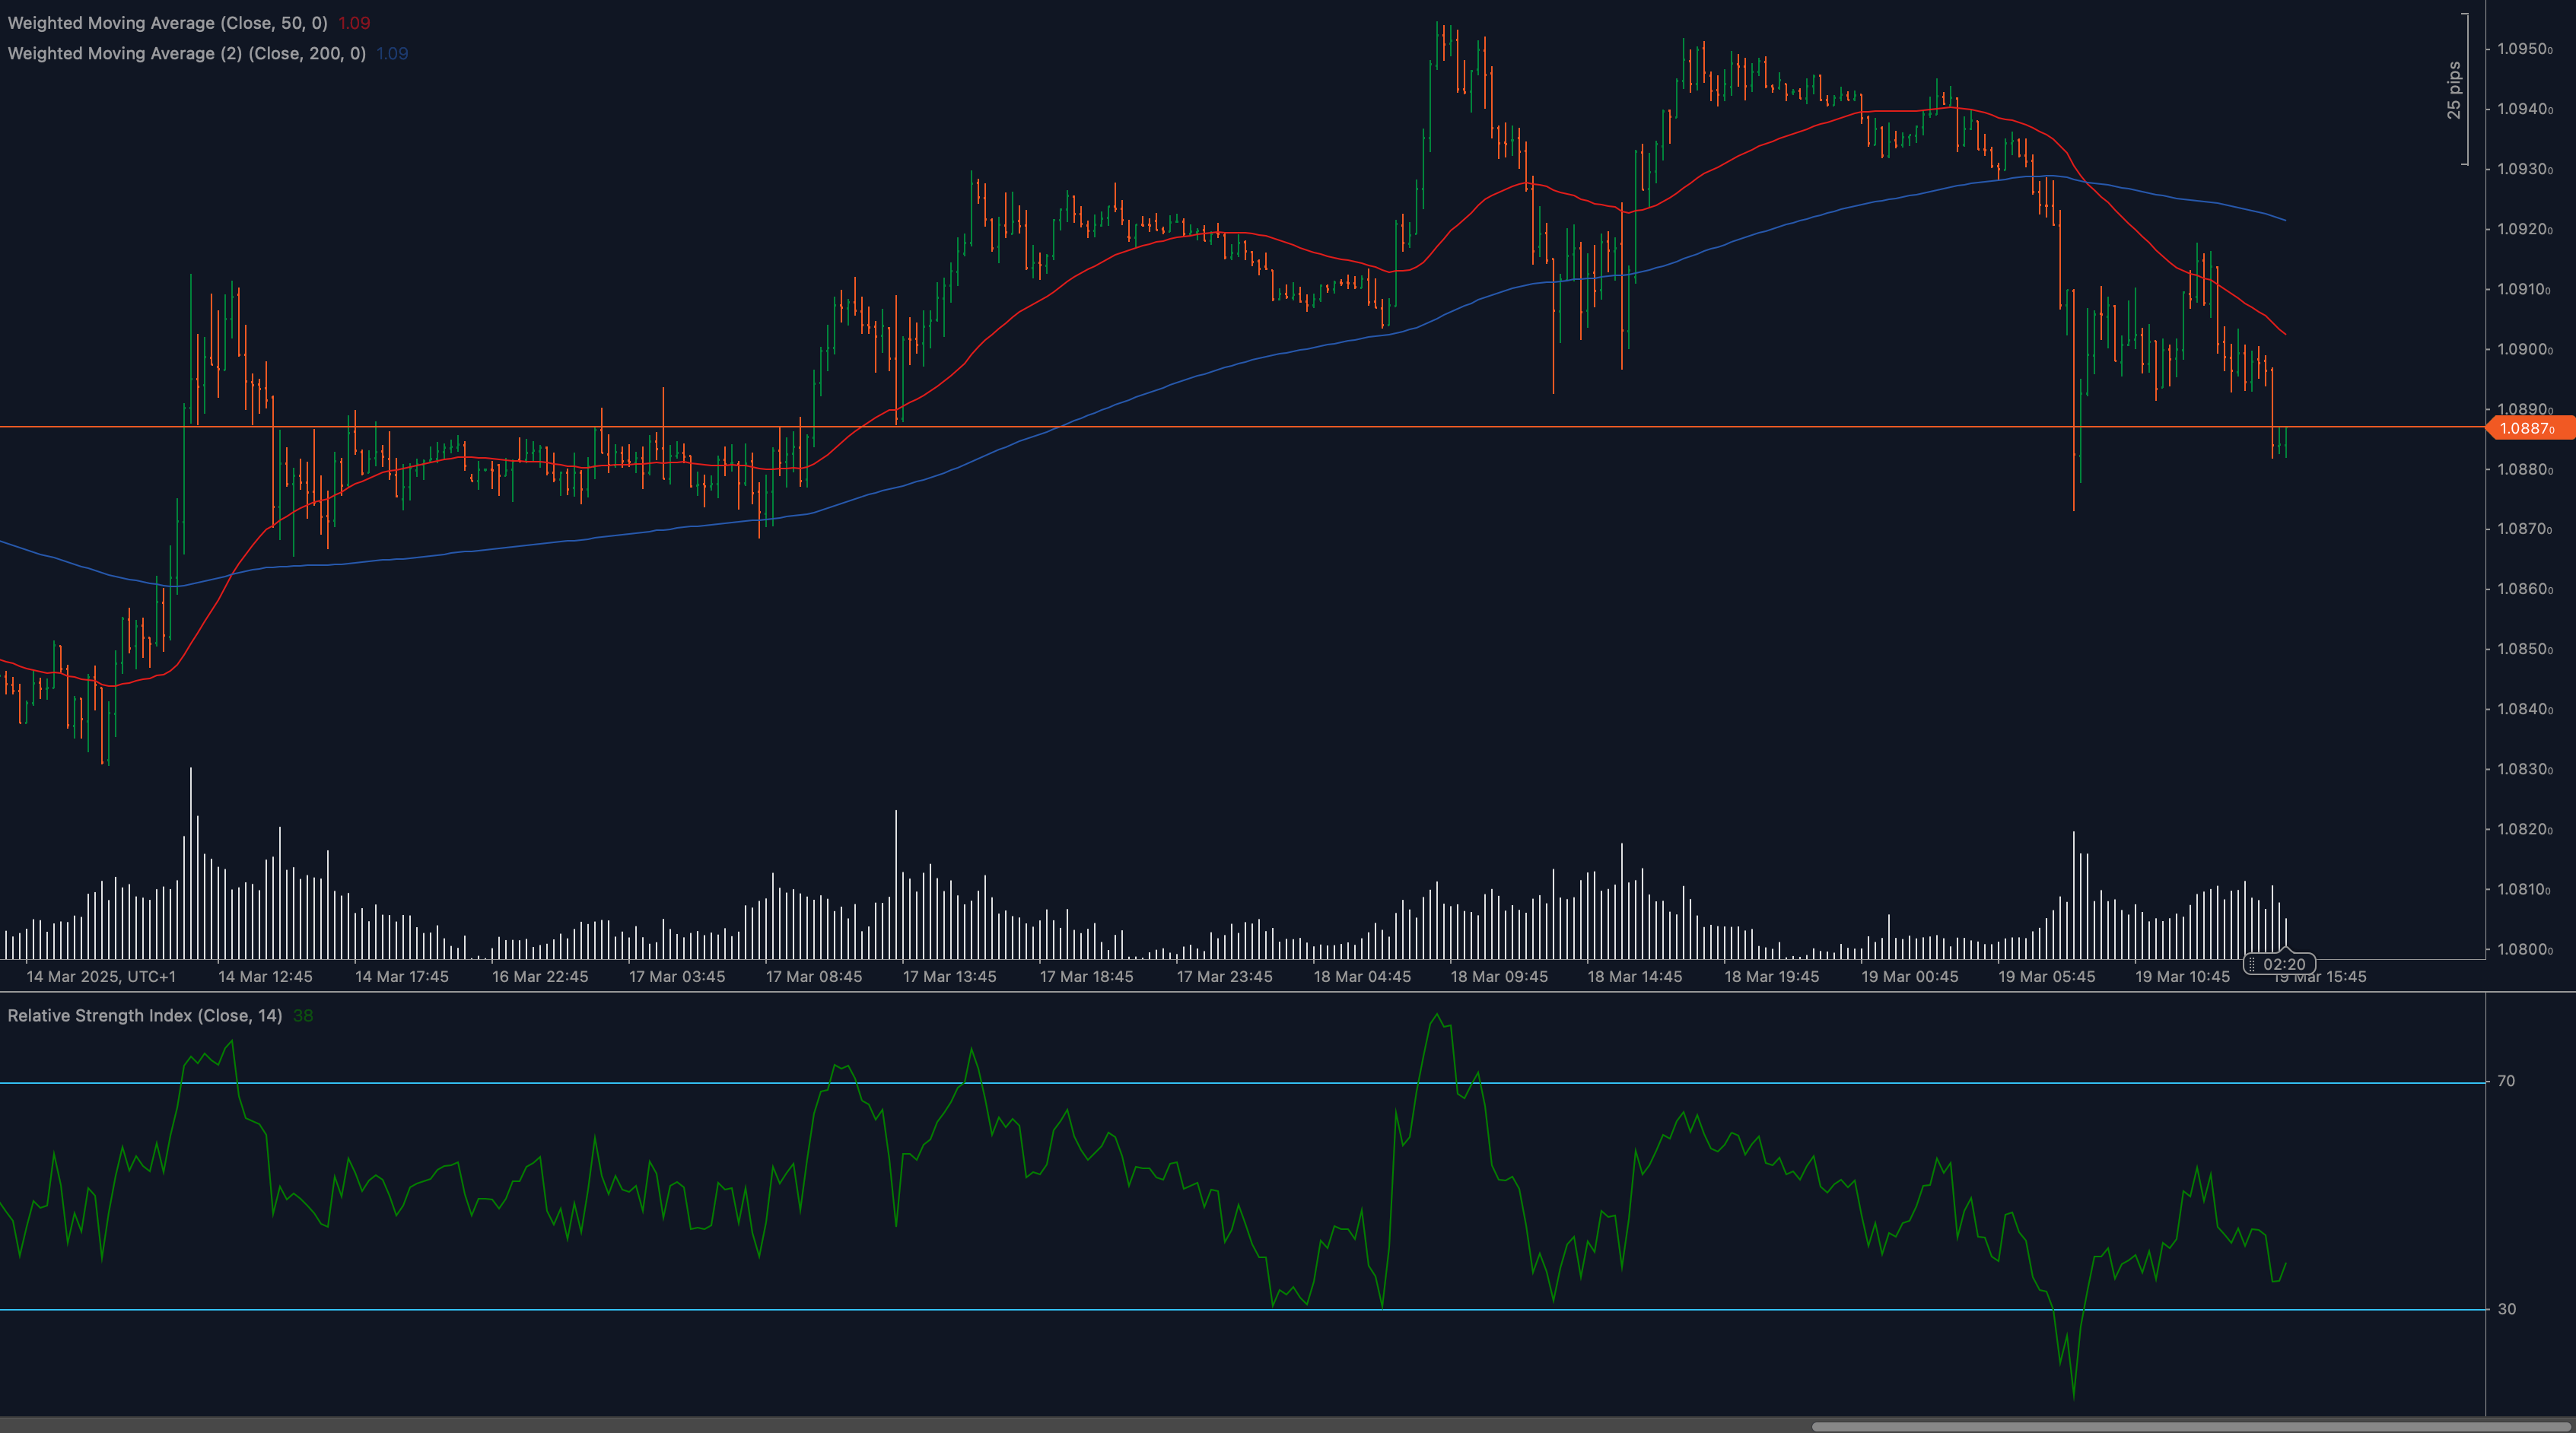
Moving Average Analysis and Dynamic Price Levels
The moving average configuration is distinctly bearish, with the 50-day moving average (red line) crossing below the 200-day moving average (blue line). This bearish crossover, often referred to as a “death cross,” signals significant downside momentum and confirms the strength of the current downtrend. Price action is now consistently trading below both major moving averages, with the 50-day MA at approximately 1.0950 acting as dynamic resistance. The declining slope of both moving averages further reinforces the bearish outlook for EURUSD in the near term.
RSI Momentum Analysis and Divergence Patterns
The Relative Strength Index (RSI) reading of 14 is showing oversold conditions, currently hovering around the 30 level after recently dipping below it. While this suggests the potential for a short-term technical bounce, the absence of any bullish divergence (where price makes new lows but RSI doesn’t) indicates that downward momentum remains strong. The RSI has been making lower highs and lower lows, aligning with the price action and confirming the bearish trend rather than contradicting it.
Price Action and Candlestick Analysis
Recent candlestick formations reveal significant bearish pressure, with several strong red candles showing decisive selling interest. The price action shows rejection at attempts to climb back above the 1.0900 level, with sellers consistently stepping in at higher levels. The most recent candles display long upper wicks, indicating that buyers are being overwhelmed by sellers even during intraday recovery attempts. This pattern of selling pressure on rallies is a classic characteristic of a strong downtrend.
Chart Patterns and Formation Analysis
The EURUSD has formed a clear descending channel pattern over the analyzed period, with prices making consecutive lower highs and lower lows. We’ve also witnessed a rounded top formation that has now completed, suggesting the resumption of the broader downtrend. The recent breakdown below 1.0900 came after multiple tests of this support level, signifying that buyers have finally capitulated, which often leads to accelerated downside movement as stop losses are triggered.
Fibonacci Retracement Levels and Extension Targets
Based on the previous upward move from March lows to recent highs, the 61.8% Fibonacci retracement level aligns closely with the 1.0850 support level, making this a particularly important zone to watch. If this level fails to hold, the 78.6% retracement at approximately 1.0820 becomes the next target. For potential downside extension targets, the 100% and 161.8% Fibonacci extensions project potential moves to 1.0780 and 1.0720 respectively, should the bearish momentum continue unabated.
🔍 MARKET OUTLOOK & TRADING SCENARIOS
Bullish Scenario for EURUSD
For a bullish reversal to materialize, EURUSD would need to reclaim the 1.0900 level decisively, followed by a move above the 50-day moving average around 1.0950. Such a recovery would likely require a significant catalyst, such as a shift in Federal Reserve policy expectations or positive economic surprises from the Eurozone. If this occurs, the pair could target the 1.1000 psychological resistance, followed by 1.1050. The RSI’s current oversold condition does provide some technical grounds for a potential bounce, but this would likely be corrective rather than trend-changing without fundamental support.
Neutral Scenario for EURUSD
A consolidation phase could emerge if EURUSD stabilizes between 1.0850 and 1.0900. In this scenario, we might see range-bound trading as the market digests recent moves and awaits fresh catalysts. The 50-day moving average could gradually flatten in this case, suggesting diminishing momentum. Traders might look for short-term opportunities within this range while major directional signals remain absent. This neutral scenario would likely be characterized by decreasing volatility and volume.
Bearish Scenario for EURUSD
The most probable scenario based on current technical signals is continued bearish pressure. A failure to reclaim 1.0900 would likely lead to a test of 1.0850, and potentially 1.0820 support levels. The bearish moving average crossover suggests that rallies will be sold, keeping pressure on the pair. If economic data continues to support dollar strength, we could see an acceleration toward 1.0780. The lack of bullish divergence on the RSI, despite oversold conditions, indicates that downside momentum remains intact and could persist in the coming sessions.
💼 TRADING CONSIDERATIONS
When trading EURUSD in the current environment, risk management becomes particularly crucial. Consider placing stops above the 1.0950 level for short positions to protect against unexpected upside volatility. For those looking to enter short positions, pullbacks to the 1.0900 resistance (previously support) might offer optimal entry points with favorable risk-reward ratios.
Traders should remain aware of key economic releases from both the Eurozone and the United States, as these could trigger significant volatility. Particularly important will be inflation data, central bank communications, and growth indicators that might shift interest rate expectations for either economy.
Position sizing should be conservative given the recent increase in market volatility. Consider using smaller lot sizes and wider stops to accommodate potential whipsaws in price action. For those looking to catch a potential bullish correction, waiting for clear reversal signals rather than trying to pick the exact bottom would be prudent – look for a daily close above 1.0900 accompanied by positive RSI momentum before considering long positions.
🏁 CONCLUSION
The EURUSD pair is displaying strong bearish characteristics after breaking below the critical 1.0900 support level. The bearish moving average crossover, continued selling pressure, and breakdown of key support all point to further downside potential in the near term. While oversold conditions on the RSI suggest a possible technical bounce, the overall trend remains firmly bearish until we see a significant reversal in price action and moving average configuration.
Traders should focus on the 1.0850 and 1.0820 support levels as potential targets for the current move, while keeping 1.0900 and 1.0950 in view as key resistance levels that need to be overcome for any meaningful recovery. As always in forex trading, maintaining discipline with stop losses and position sizing will be essential for navigating this volatile market environment.
⚠️ DISCLAIMER
This analysis is provided for informational purposes only and should not be considered as financial advice. Trading forex involves significant risk and may not be suitable for all investors. Past performance is not indicative of future results. Always conduct your own research and consider your financial situation and risk tolerance before making any trading decisions. The author and publisher are not responsible for any losses incurred based on this analysis.


