
📊 MARKET OVERVIEW
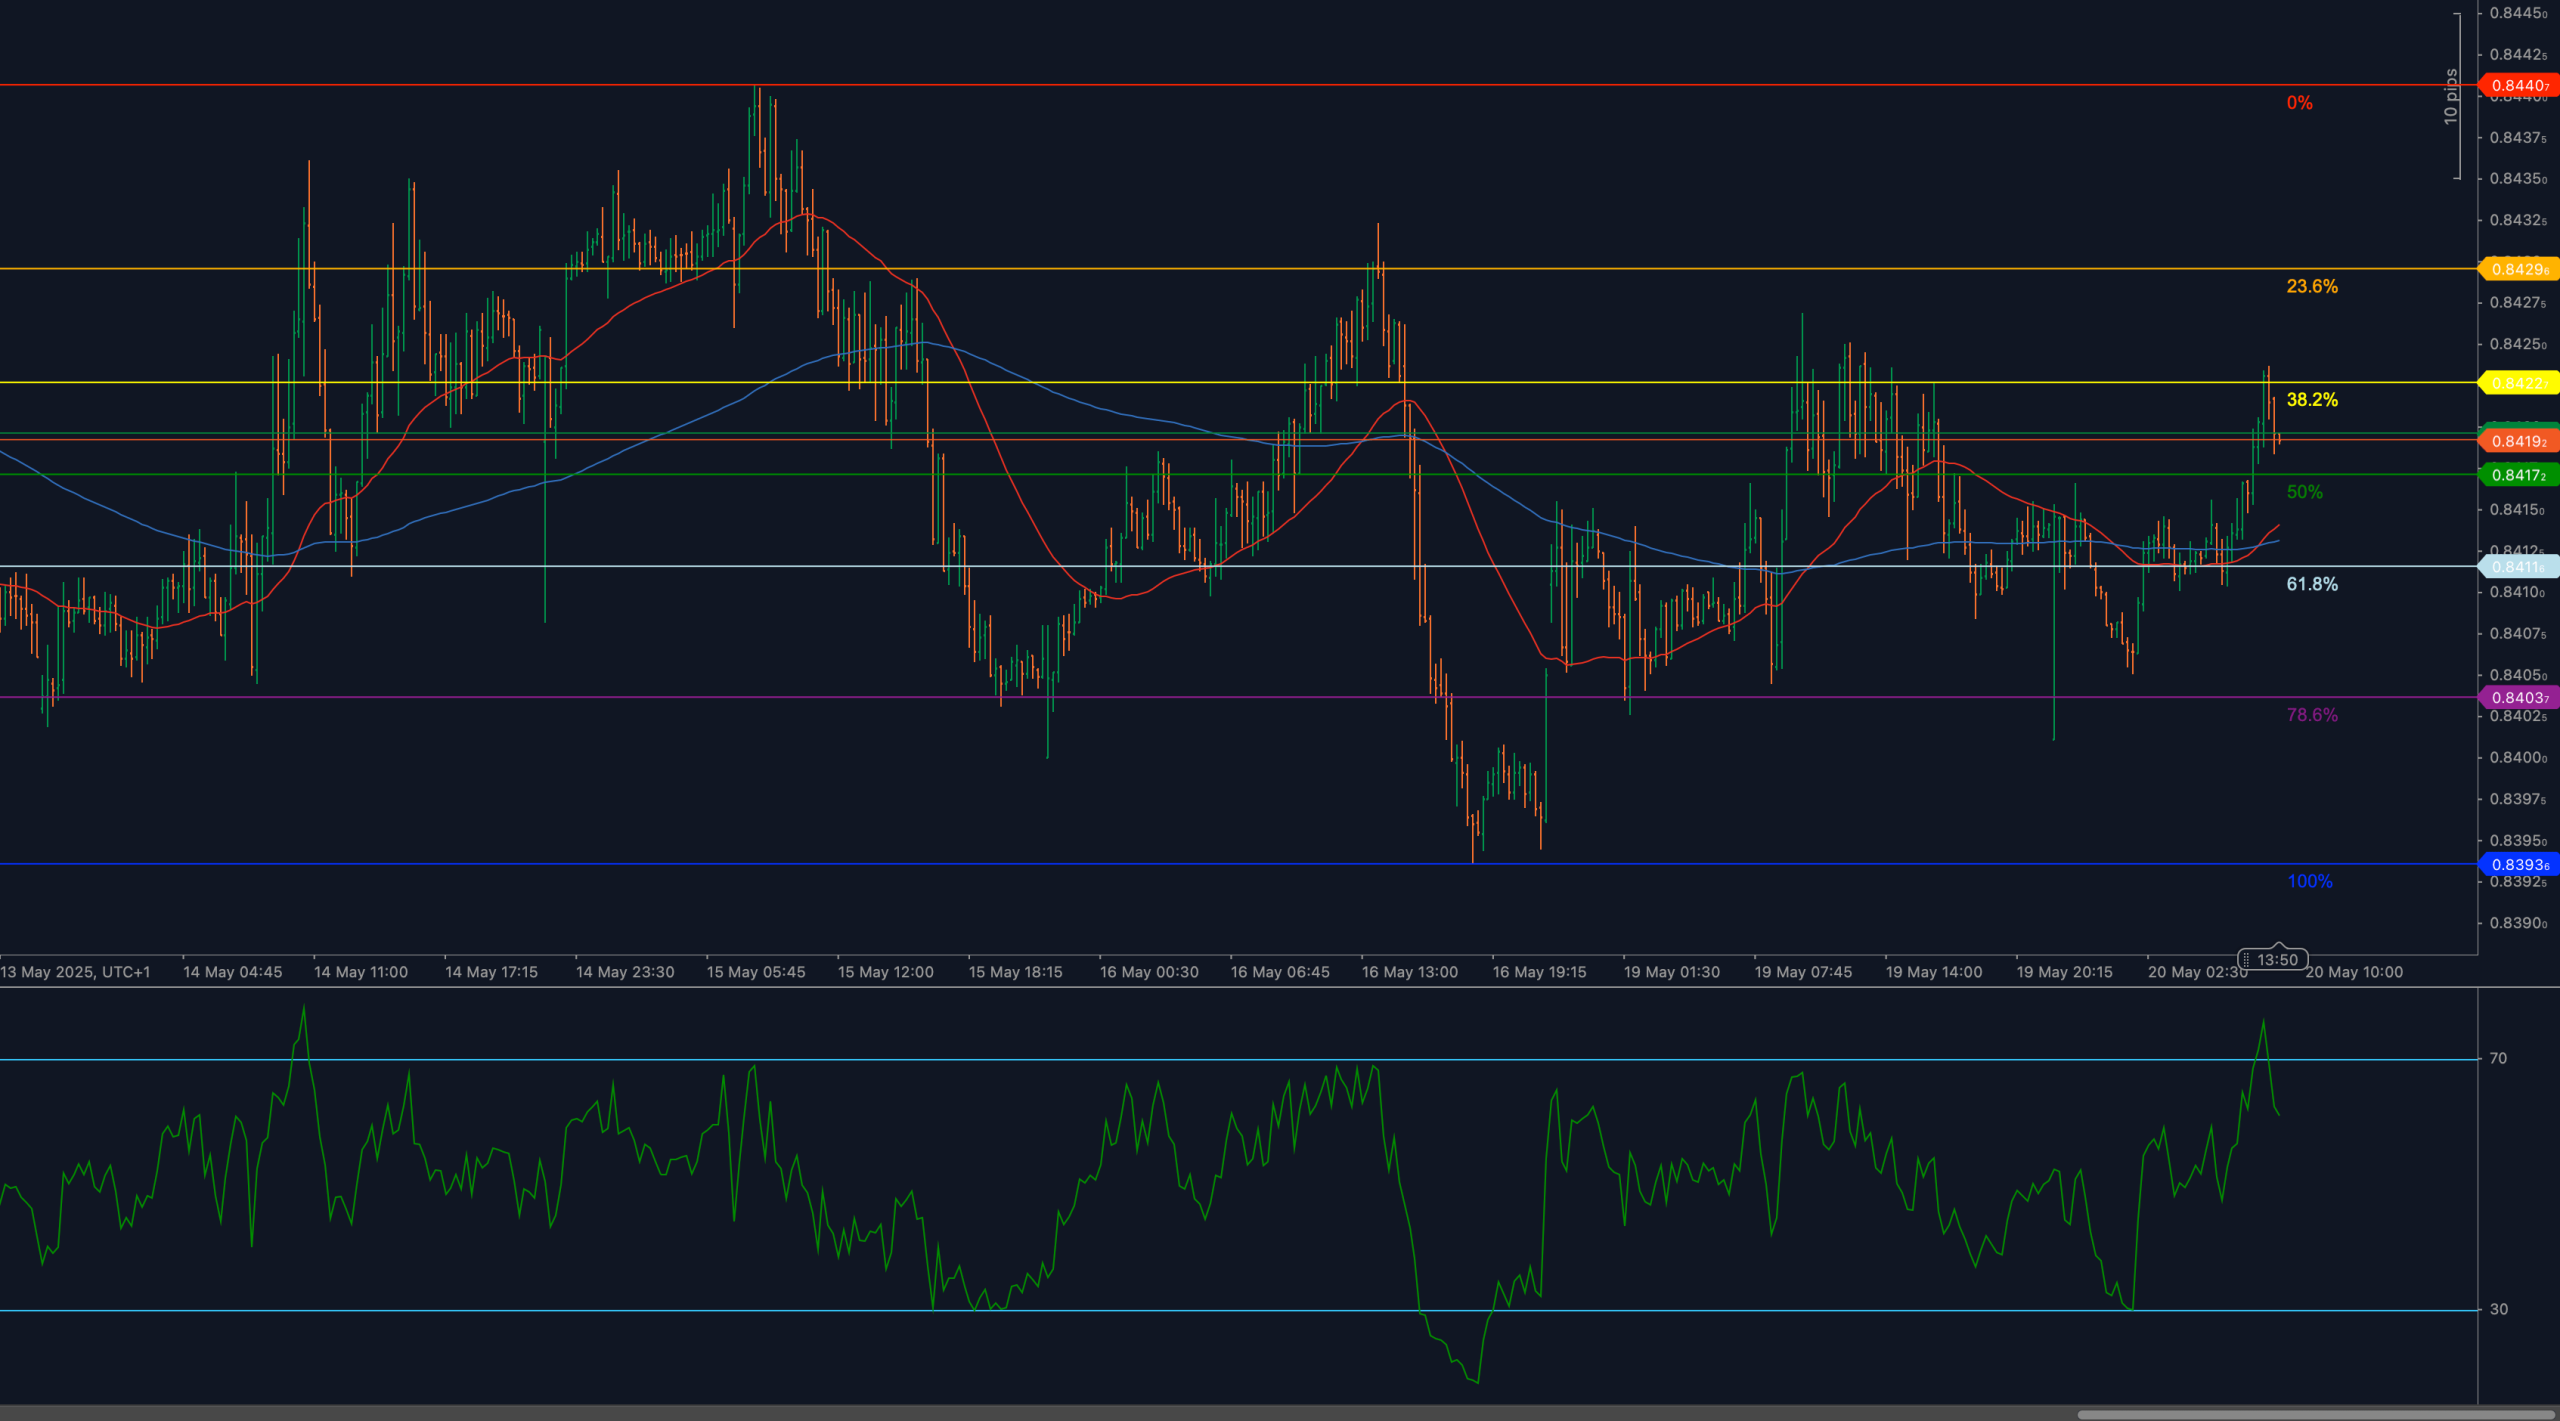
EUR/GBP surged earlier in the session but has since stalled at 0.8417, a level aligning with the 38.2% Fibonacci retracement of the broader downswing from 0.8444 to 0.8383. Despite a short-term bounce, the pair remains capped below major moving averages and is struggling to sustain momentum as buyers lose traction.
The recovery was driven largely by a weaker pound during early London trade, but macro conviction remains limited. With RSI rolling over from 70, and price showing hesitation near Fibonacci resistance, bullish control appears tentative. Unless buyers break decisively above 0.8417, a pullback toward 0.8411 or deeper may follow.
📈 TECHNICAL ANALYSIS
Key Support and Resistance Levels
Immediate resistance is located at 0.8417, corresponding to the 38.2% retracement. A close above this level would be required to unlock the upper zones at 0.8422 and 0.8444, the latter marking the full retracement peak of the May 16 high.
To the downside, initial support lies at 0.8411, followed by the 50% retracement at 0.8405. A confirmed break of these levels would expose the 61.8% retracement at 0.8411, and deeper support near the 78.6% level at 0.8403, before a potential retest of the swing low at 0.8383.
Moving Averages and Dynamic Price Action
Price action remains technically constrained below both the 50-period and 200-period weighted moving averages, with the 50-WMA flat and the 200-WMA acting as a dynamic ceiling near 0.8419. Until price breaks and closes above this confluence, short-term upside remains limited.
A break above both moving averages would shift short-term structure back in favor of buyers. Until then, any bounce may be viewed as corrective within the broader pullback range.
RSI Momentum and Bearish Pressure
The 14-period RSI approached 70 on the latest surge, but has since rolled over and is now pointing lower, reflecting fading momentum. The rejection at the upper threshold suggests that the current leg may be overextended, and unless RSI reclaims strength above 65, downside risk will build.
If RSI dips below 50, it would signal a full momentum reset and confirm the probability of a pullback toward mid-range support.
Candlestick Behavior and Price Action Clarity
Candlesticks near 0.8417 show upper shadows and hesitation — an early signal of rejection pressure. The lack of a full-bodied breakout candle above resistance, combined with a lower close and fading RSI, confirms that bulls are not fully in control. A clean engulfing candle above 0.8417 would be needed to neutralize current weakness.
Absent that, sellers may begin to test the downside in the coming sessions.
Chart Structure and Breakdown Formation
The broader structure remains corrective following the earlier decline toward 0.8383. While the rebound lifted price back into Fibonacci territory, the pair has failed to reclaim any decisive swing levels. The inability to clear 0.8417confirms that the current move remains counter-trend and vulnerable to rollover.
Unless price breaks above the 200-WMA and prior pivot highs, the pattern remains a retracement leg within a larger bearish sequence.
Fibonacci Retracement and Extension Levels
The Fibonacci retracement drawn from 0.8383 (May 16 low) to 0.8444 (May 15 high) highlights key intraday zones. The rally reached the 38.2% retracement at 0.8417, but failed to sustain above it. A continued failure here may lead to rotation back toward the 50% retracement at 0.8411 and the 61.8% level at 0.8405, both of which are structurally important for short-term bias.
If these supports break, further downside could unfold toward the 78.6% retracement at 0.8403, with the full move completed at 0.8383. If instead price manages to break 0.8417 with follow-through, then the 23.6% level at 0.8422becomes the next objective, followed by a full retest of 0.8444.
🔍 MARKET OUTLOOK & TRADING SCENARIOS
Bullish Scenario
A clean breakout above 0.8417, supported by RSI reclaiming 65+, would confirm short-term bullish continuation. In that case, targets include 0.8422 and 0.8444, with moving averages turning supportive on follow-through.
Neutral Scenario
Sideways trade between 0.8411–0.8417 would suggest hesitation and consolidation. RSI holding between 55–60 would reflect indecision. Directional resolution would depend on breakout confirmation or loss of trend support.
Bearish Scenario
A rejection at 0.8417, confirmed by RSI falling below 50, would turn the outlook bearish. This would activate downside targets at 0.8411, 0.8405, and potentially 0.8383.
💼 TRADING CONSIDERATIONS
Short-term traders may fade rallies near 0.8417 while RSI remains capped. Breakout confirmation above this level is needed to switch bias to bullish. On the downside, support tests at 0.8411–0.8405 offer tactical zones for reactions or breakout continuation plays toward 0.8383.
🏁 CONCLUSION
EUR/GBP has tested the 38.2% Fibonacci retracement at 0.8417 but failed to hold above it. With RSI rolling off 70, and price capped below moving averages, momentum remains fragile. A breakout above 0.8417 would renew the uptrend, but unless that occurs, the path of least resistance points toward 0.8411, 0.8405, and possibly 0.8383.
⚠️ DISCLAIMER
This analysis is for informational purposes only and does not constitute financial advice. Always consult with a licensed financial professional before making trading decisions.


