
📊 EUR/GBP: At a Critical Juncture Near 0.8565 Resistance
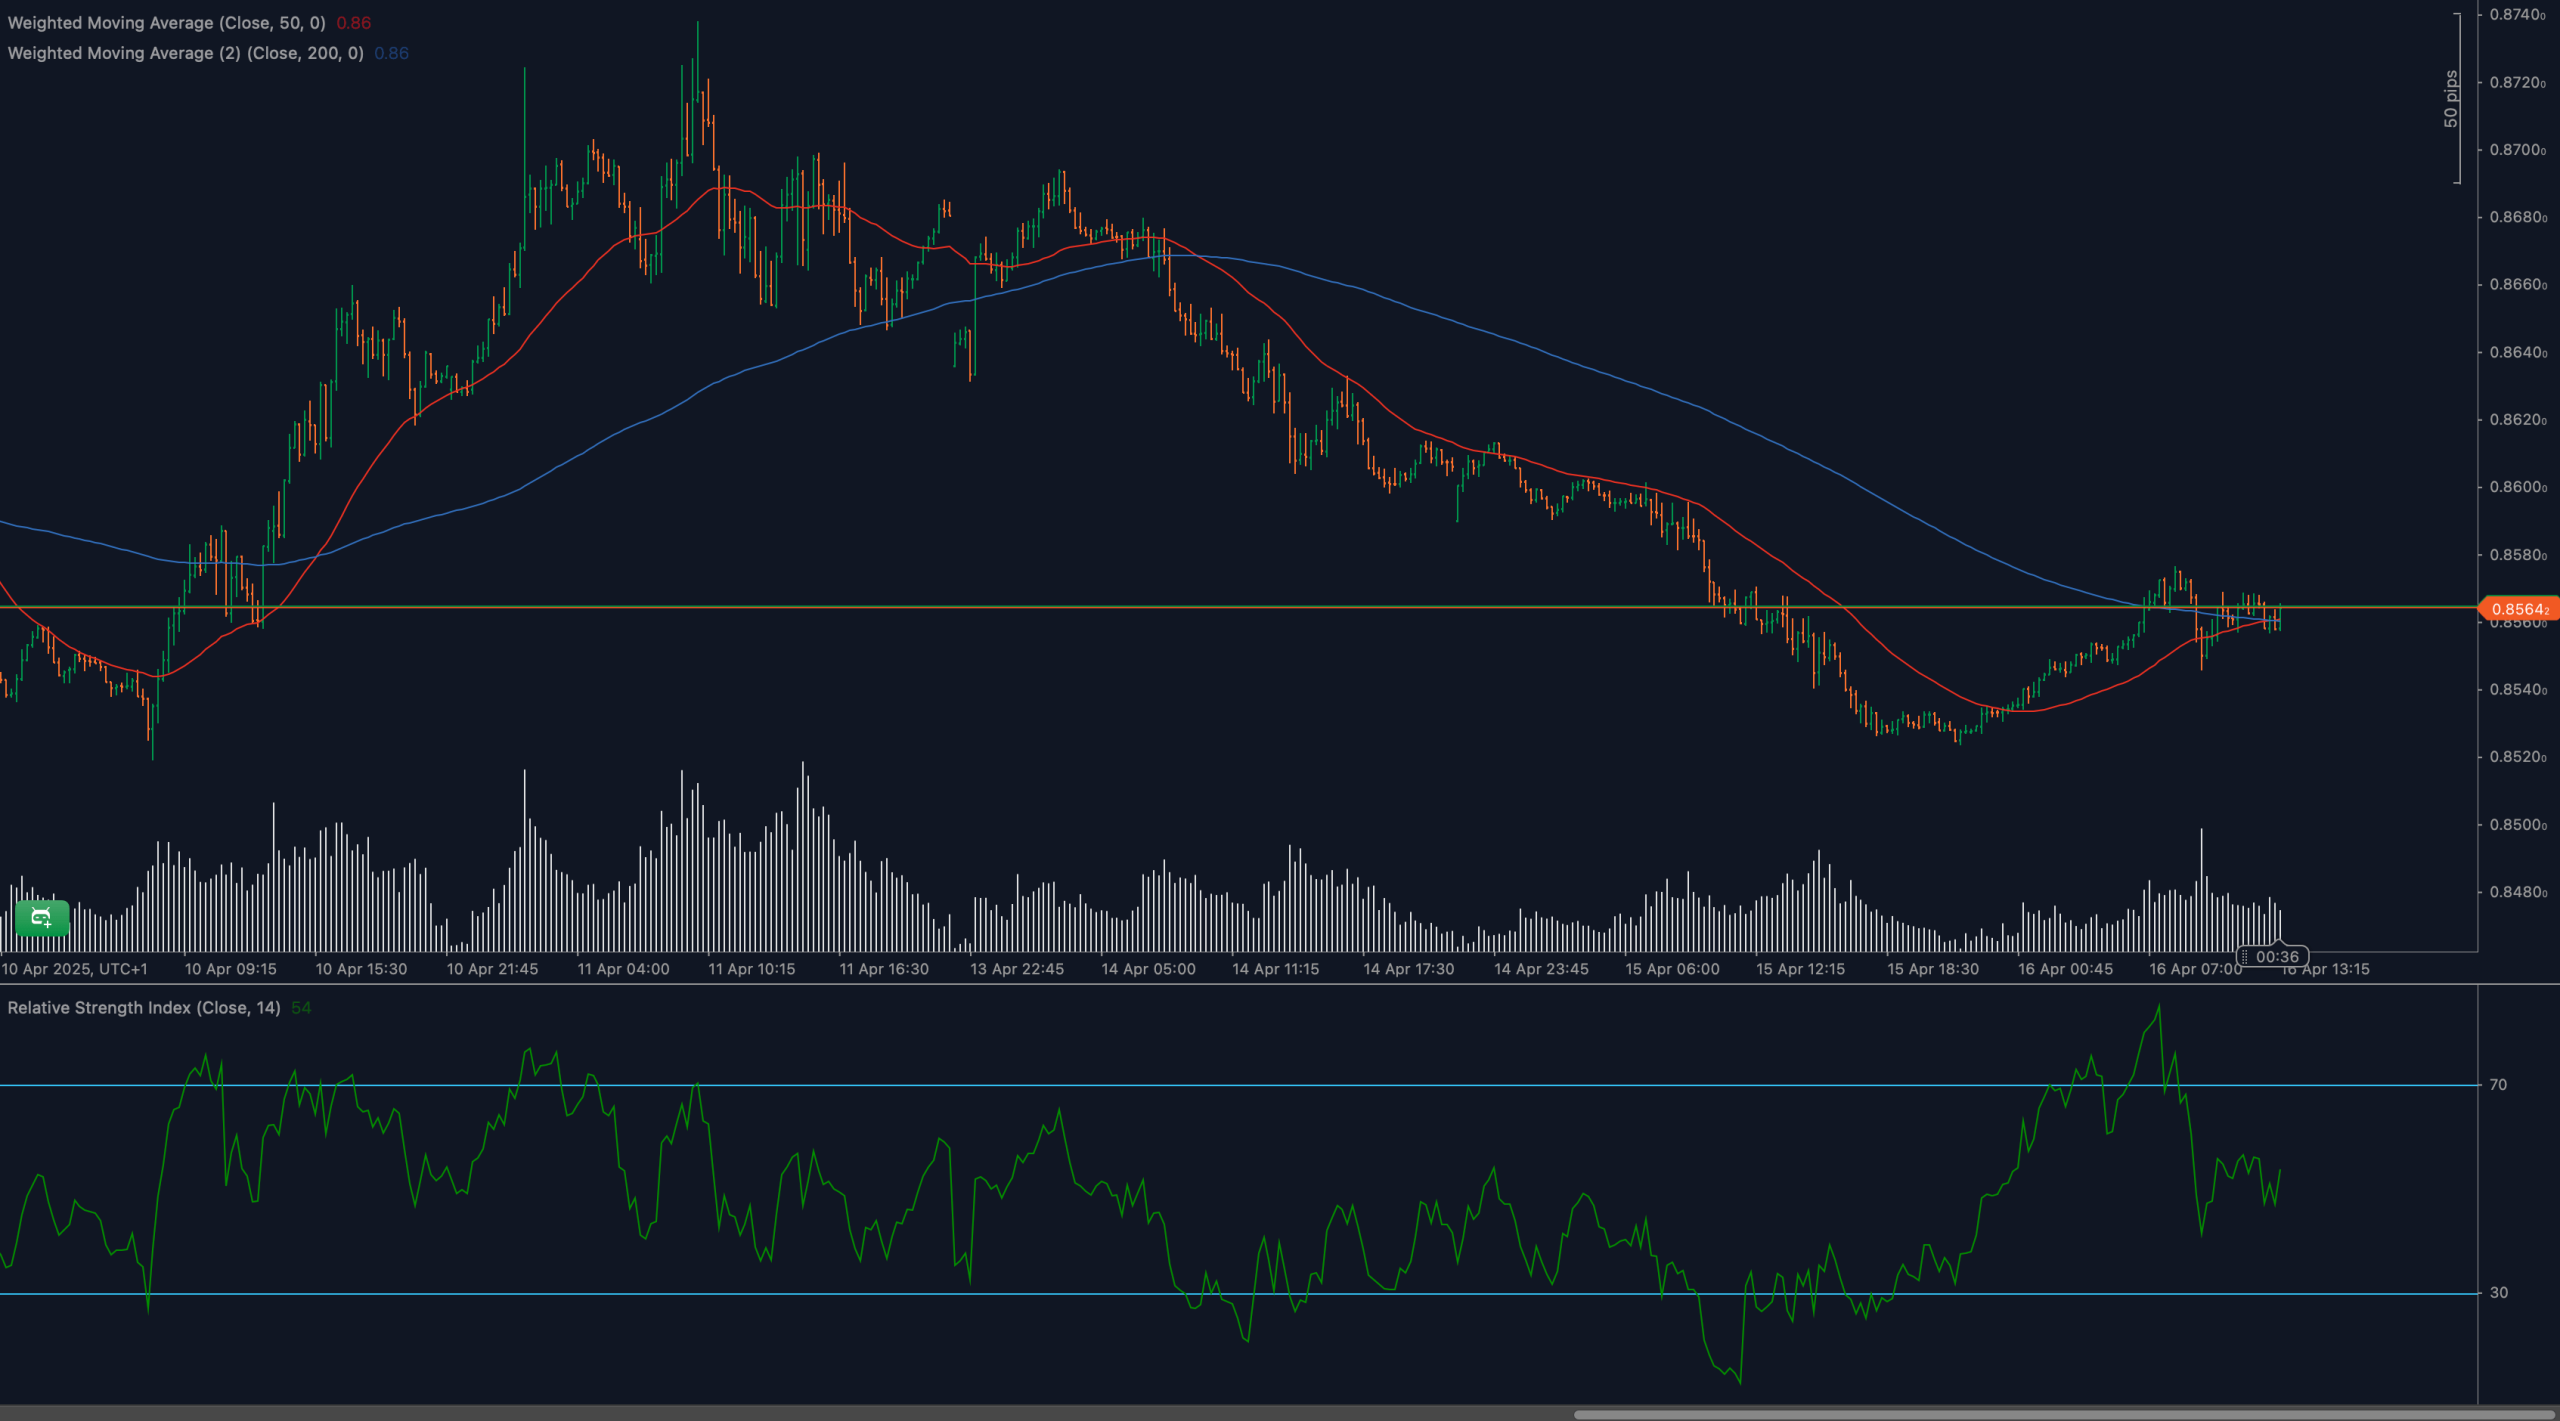
The EUR/GBP pair has staged a noteworthy short-term rebound, pushing up from below the 0.8500 psychological level to challenge the 0.8565 region. This area is proving to be a formidable barrier, marked by a confluence of both significant price action history and key moving average resistance. Specifically, the pair is testing the 200-period Weighted Moving Average (WMA) from beneath, struggling to find sustained closes above the 0.8565 threshold.
Despite this recent upward push, the underlying bullish momentum appears to be waning. We’re observing a noticeable decline in trading volume, coupled with the 14-period Relative Strength Index (RSI) cooling significantly from its recent overbought readings (above 70). These combined signals suggest caution for traders trying to determine if this recovery is merely a temporary retracement within a larger downtrend, or the nascent stages of a broader reversal. The pair’s immediate reaction around this crucial 0.8565 level will likely dictate its near-term trajectory.
📈 In-Depth Technical Breakdown
Key Levels: Navigating Support and Resistance
Immediate and persistent resistance is clearly defined at 0.8565. This level has been re-tested multiple times since the recent recovery began, consistently rejecting higher prices. A decisive break and sustained close above this zone would be a strong bullish signal, potentially opening the path towards 0.8600, a psychological round number, and subsequently 0.8625. Conversely, if 0.8565 continues to hold, initial support is anticipated at 0.8540. A breach here could accelerate a decline towards stronger downside targets at 0.8505 and the pivotal 0.8480 low.
Dynamic Price Action: Moving Averages in Focus
The EUR/GBP is currently interacting directly with the 200-period WMA at approximately 0.8565, which is actively functioning as a dynamic ceiling. Meanwhile, the 50-period WMA has recently begun to turn upwards, providing immediate short-term support around 0.8550. The tight convergence of both these critical WMAs right at current price levels amplifies the significance of this zone, indicating a critical inflection point for the pair’s next directional move. Traders should watch for a definitive cross or rejection here.
Momentum Shifts: RSI Divergence & Trend Confirmation
The 14-period RSI, after touching overbought levels above 70, has now retreated to around 54. This substantial pullback signals a clear reduction in bullish conviction, suggesting the recent rally may have become overextended without strong underlying support. While no explicit bearish divergence has yet formed, a continued softening or outright decline in the RSI below 50 would strongly bias the pair towards renewed selling pressure, especially if price fails to overcome immediate resistance. The RSI’s future trajectory will be crucial for confirming sustained momentum in either direction.
Candlestick Clues: Buyer Hesitation at Resistance
The candlestick patterns forming directly at the 0.8565 resistance level convey a narrative of indecision and potential buyer exhaustion. We’re observing multiple narrow-bodied candles with noticeable upper wicks, indicating that bulls are struggling to maintain control and that selling pressure is increasing at higher prices. Although a definitive bearish reversal pattern (like an engulfing candle or a shooting star with strong follow-through) hasn’t fully materialized, the consistent failure to close convincingly above resistance, combined with these indecisive candle formations, suggests growing skepticism from the market regarding further upside.
Chart Patterns: Flag or Wedge Setting the Stage?
Following its recent rally, the EUR/GBP appears to be consolidating, potentially forming a small bearish flag or a rising wedge pattern directly beneath the 0.8565 resistance. These patterns are typically continuation patterns that follow a strong move and suggest a potential for reversal if confirmed. A decisive breakdown and close below 0.8540would validate a bearish flag or wedge, potentially triggering a decline towards the 0.8500 psychological level. Conversely, a strong bullish breakout and sustained move above 0.8565 would negate these patterns, signaling a continuation of the rally.
Fibonacci Levels: Pinpointing Retracement & Extension Targets
Drawing Fibonacci retracement levels from the recent swing low near 0.8480 to the rally high of 0.8565, the 38.2% retracement lies close to 0.8535, which is a critical short-term support to watch. The 61.8% level at 0.8510 aligns closely with previous structural support, representing a stronger potential bounce zone if the current resistance holds. Should the rally manage to extend beyond 0.8565, Fibonacci extensions project logical upside targets at 0.8600 and 0.8625.
🔍 Market Outlook & Actionable Trading Scenarios
Bullish Scenario: Breaking Higher
A decisive close above 0.8565, ideally accompanied by increasing volume and the 14-period RSI turning back above 60, would validate a renewed bullish bias. Under this scenario, aggressive bulls might target 0.8600 and subsequently 0.8625. Such a move would require the pair to firmly establish itself above the 200-WMA, confirming a significant shift in the price structure.
Neutral Scenario: Range-Bound Consolidation
If the pair continues to oscillate strictly between 0.8540 and 0.8565, we anticipate a period of consolidation. This would likely be accompanied by the RSI holding within the 50-60 range and candlestick patterns reflecting mixed sentiment. This scenario suggests market indecision, where traders might opt to wait for a definitive breakout or breakdown confirmation before initiating new positions.
Bearish Scenario: Rejection and Reversal
A clear failure to breach 0.8565, followed by a sustained move below 0.8540, would strongly favor a bearish reversal. If the RSI also rolls over and dips below 50, it would reinforce a short setup. In this case, key downside targets become 0.8510 and then 0.8480, with the potential for an extended decline if bearish momentum truly strengthens.
💼 Trading Considerations
Traders with a bearish conviction could look for short entry opportunities on a confirmed rejection of 0.8565, particularly if accompanied by a bearish candle formation and declining RSI. Stop-losses could be placed conservatively above 0.8570 or a recent swing high, targeting 0.8510 and 0.8480.
Conversely, bullish traders should demand a strong, convincing close above 0.8565 with volume confirmation and positive RSI momentum before considering long positions. Initial targets could be 0.8600, with stop-losses placed strategically below 0.8535.
Given the overlapping technical signals at the current price, extra caution is warranted. Look for a strong, high-volume confirmation candle in either direction to validate your trading decision.
🏁 Conclusion: EUR/GBP at a Crossroads
The EUR/GBP pair is currently poised at a critical technical juncture near 0.8565, where both key moving averages and horizontal resistance converge. While the recent rally has been robust, momentum indicators signal softening, and price action exhibits clear signs of hesitation. The upcoming trading sessions will be pivotal in determining the next significant move – whether it’s a confirmed breakout continuation towards higher resistance, or a decisive rejection leading to a deeper retracement back towards recent lows.
⚠️ DISCLAIMER
This analysis is for informational and educational purposes only and does not constitute financial or trading advice. Trading foreign exchange and other leveraged products involves substantial risk of loss and may not be suitable for all investors. Always perform your own thorough analysis and consult with a licensed financial professional before making any trading decisions. Past performance is not indicative of future results.


