
📊 MARKET OVERVIEW
The EURGBP pair has demonstrated significant bullish momentum in recent trading sessions, breaking above the critical resistance level at 0.8430. This technical breakthrough comes after a period of consolidation, with the pair now trading at approximately 0.8442 as of March 11, 2025. The cross is currently supported by a golden cross formation where the 50-period moving average has crossed above the 200-period moving average, signaling potential for continued upward movement in the near term.
📈 TECHNICAL ANALYSIS
What Are the Key Support and Resistance Levels for EURGBP?
EURGBP has established several critical technical levels that traders should monitor. The immediate resistance now sits at 0.8445, with further resistance potentially at the 0.8460 level. On the downside, the recently broken resistance at 0.8430 now serves as a significant support level, reinforced by the 50-period moving average. Secondary support can be found at the 0.8400 psychological level, with the 200-period moving average providing additional support around 0.8395.
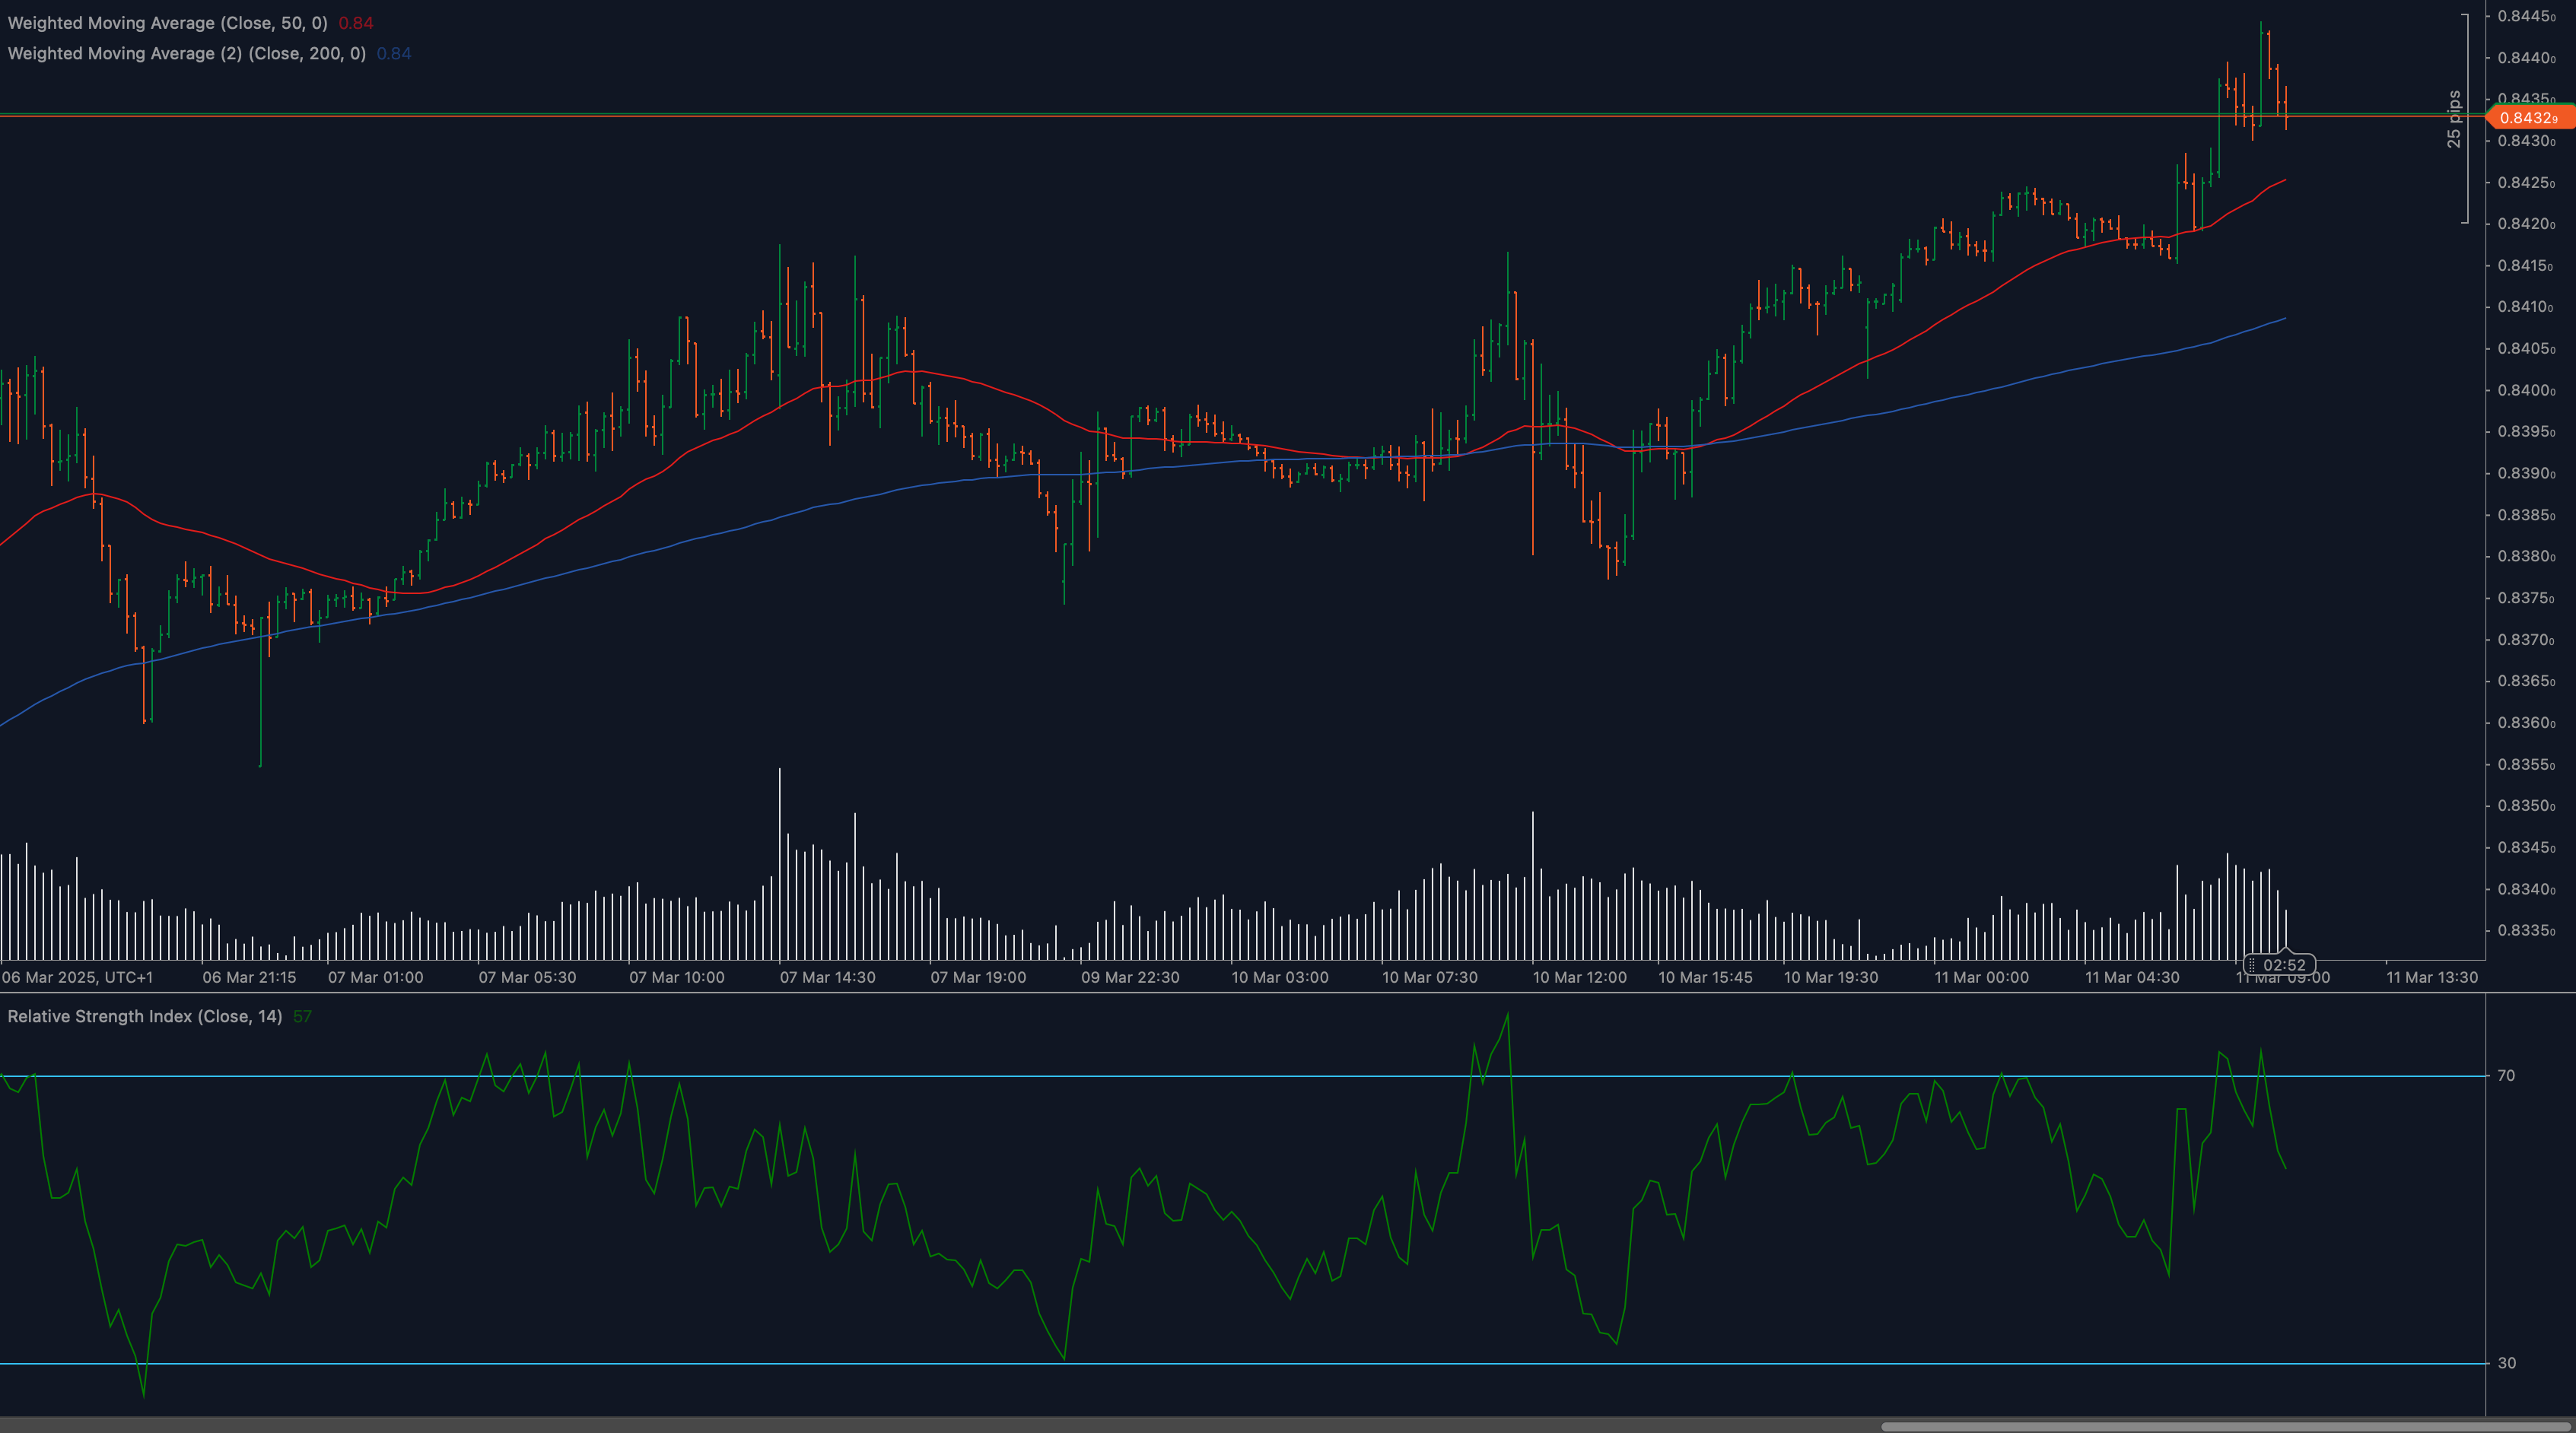
Moving Average Analysis and Dynamic Price Levels
The current technical setup showcases a bullish alignment of moving averages, with the 50-period MA (red line at approximately 0.8420) trending above the 200-period MA (blue line at approximately 0.8395). This golden cross formation that occurred during the March 9-10 trading sessions provides a strong technical foundation for bullish momentum. Price action is currently finding support above the 50-period MA, indicating sustained buying interest. The slope of both moving averages has started to turn upward, suggesting strengthening bullish sentiment.
RSI Momentum Analysis and Divergence Patterns
The Relative Strength Index (14-period) shows strong positive momentum, oscillating between 40 and 70 levels. The RSI has recently climbed back above 60, confirming the bullish price action. No significant divergence is currently present between price and RSI, suggesting alignment between momentum and price direction. However, traders should note that RSI has reached overbought territory several times in the past week, which could indicate potential short-term pullbacks within the overall bullish trend.
Price Action and Candlestick Analysis
Recent candlestick patterns reveal a series of bullish engulfing formations that triggered the breakout above 0.8430. The last three trading sessions have produced stronger green candles with higher lows, confirming buying pressure. The notable doji candle that formed around March 10 signaled market indecision near resistance before resolving to the upside. Volume has been notably increasing during the bullish candles, further validating the strength of the buying pressure.
Chart Patterns and Formation Analysis
The EURGBP chart displays a clear ascending triangle formation that developed between March 6-10, with the horizontal resistance at 0.8430 and rising support from the lows. This classic bullish continuation pattern has now confirmed with a breakout above 0.8430. Prior to this formation, the pair had been trading in a broader range between 0.8360 and 0.8430, with the current move representing a significant shift in market structure.
Fibonacci Retracement Levels and Extension Targets
Based on the recent move from 0.8360 to 0.8444, key Fibonacci retracement levels are established at 0.8415 (23.6%), 0.8402 (38.2%), and 0.8389 (50%). These levels could act as support zones during potential pullbacks. Looking at Fibonacci extension levels from the same swing, upside targets can be identified at 0.8455 (127.2%) and 0.8472 (161.8%), providing potential profit-taking zones for bullish traders.
🔍 MARKET OUTLOOK & TRADING SCENARIOS
Bullish Scenario for EURGBP
In a bullish scenario, EURGBP would maintain support above 0.8430 and continue its upward trajectory to challenge the immediate resistance at 0.8445. A successful break above this level could pave the way toward the 0.8460-0.8472 zone, particularly if supported by strong economic data from the Eurozone or weakness in UK economic indicators. The positive alignment of moving averages would continue to provide dynamic support to price pullbacks.
Neutral Scenario for EURGBP
A neutral scenario would involve EURGBP consolidating between 0.8430 and 0.8445, with price action trapped within this narrow range while traders await further catalysts. The 50-period MA would likely continue to act as dynamic support, preventing significant downside, while overhead resistance keeps bullish momentum contained. This consolidation could form a flag or pennant pattern, potentially setting up for another directional move.
Bearish Scenario for EURGBP
Should EURGBP fail to maintain the breakout above 0.8430, a bearish reversal could unfold with price dropping back below this key level. This would invalidate the recent bullish breakout and potentially lead to a test of the 200-period MA around 0.8395. A breach below this level could accelerate selling pressure toward 0.8380 and possibly the recent lows around 0.8360. This scenario would likely be triggered by a fundamental catalyst that strengthens GBP or weakens EUR.
💼 TRADING CONSIDERATIONS
Traders looking to capitalize on the current EURGBP technical setup should consider the following strategies:
For bullish positions, entering on pullbacks to the 0.8430 support level with stops below 0.8415 could offer a favorable risk-reward ratio, targeting 0.8455 and 0.8472. Alternatively, breakout traders might consider entries above 0.8445 with similar targets, placing protective stops below the 50-period MA.
Risk management is crucial given the cross’s typically modest volatility. Position sizing should reflect the current Average True Range of approximately 40-50 pips, with stop-loss orders placed at technical levels rather than arbitrary distances.
Traders should also monitor upcoming economic data releases from both the Eurozone and UK, including inflation figures, central bank communications, and growth indicators, as these can significantly impact the EURGBP exchange rate regardless of technical patterns.
🏁 CONCLUSION
The EURGBP pair is displaying a convincingly bullish technical structure following its breakout above the critical 0.8430 resistance level. With supportive moving averages, positive RSI momentum, and clear chart pattern completion, the path of least resistance appears to be upward in the near term. However, traders should remain vigilant for signs of exhaustion at higher levels and monitor key support zones for potential reversal signals. The coming trading sessions will be crucial in determining whether this breakout can develop into a sustained uptrend or if consolidation will resume.
⚠️ DISCLAIMER
This analysis is provided for informational purposes only and should not be considered as investment advice. Trading foreign exchange carries significant risk and may not be suitable for all investors. Past performance is not indicative of future results. Traders should conduct their own research, develop their own strategies, and manage risk appropriately based on their financial circumstances and investment objectives.


