
📊 MARKET OVERVIEW
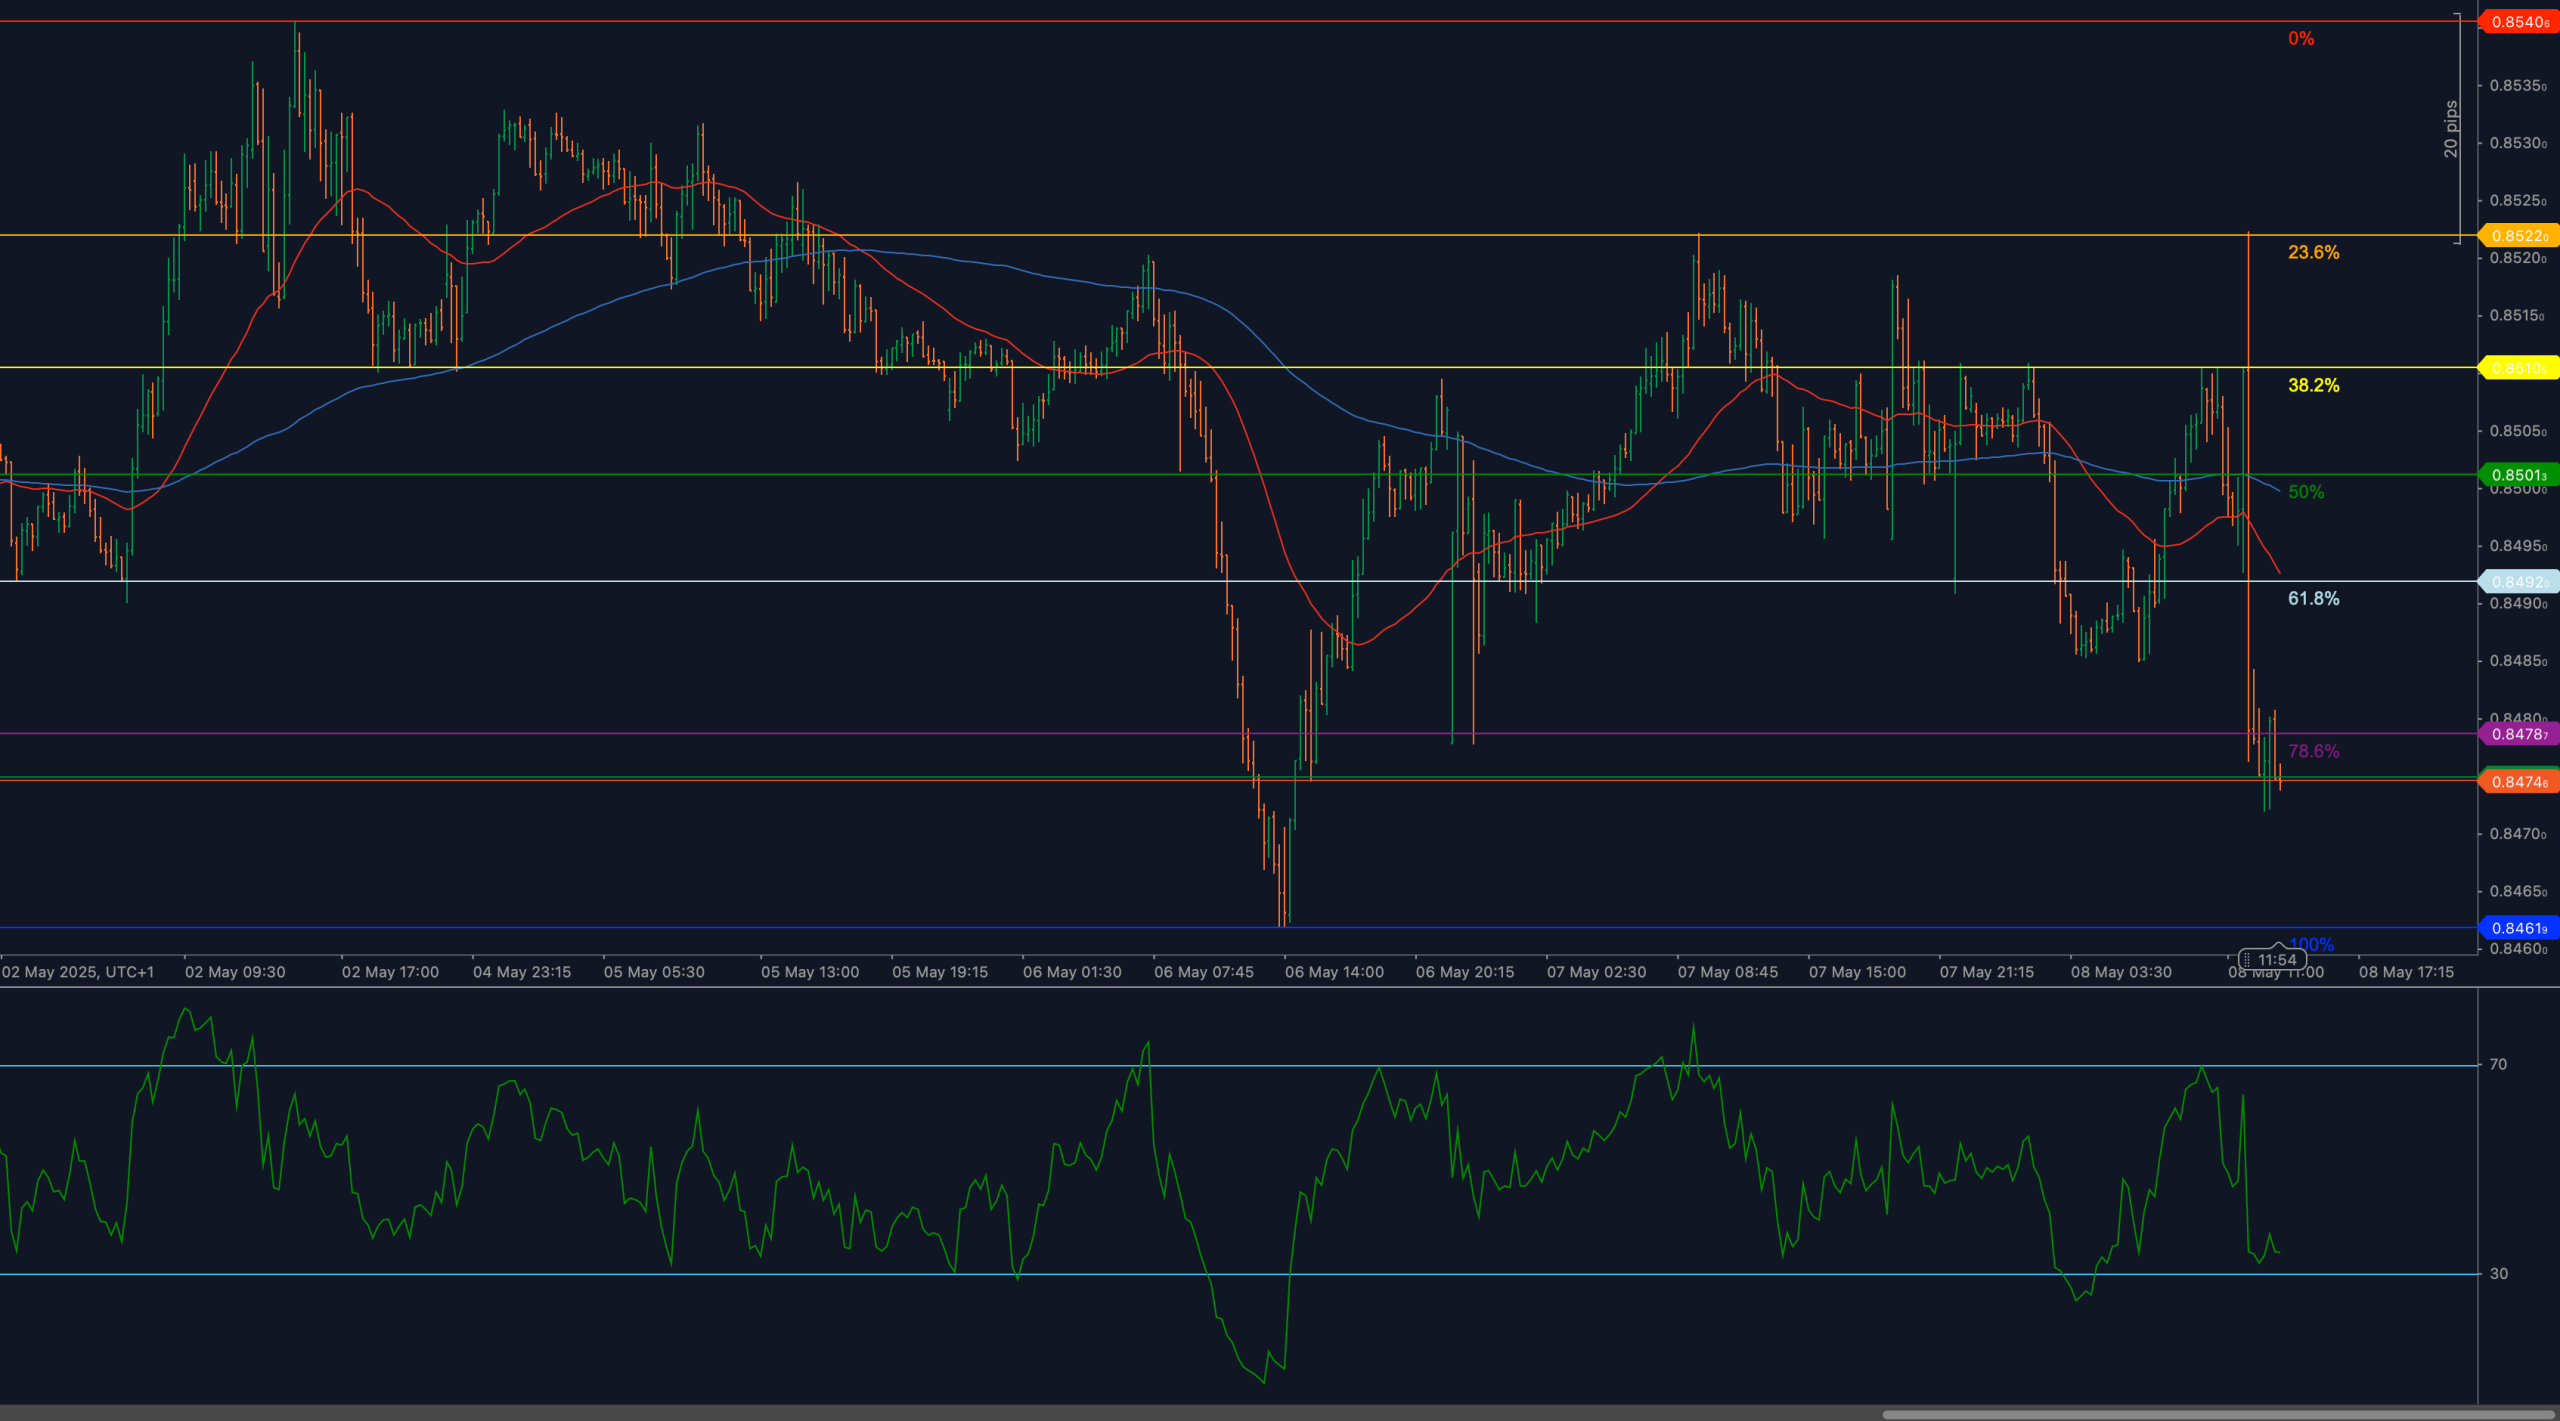
EUR/GBP has resumed downside movement after failing to hold above the 61.8% and 50% Fibonacci levels earlier in the session. Price action has turned aggressive, slicing through the 78.6% retracement at 0.8487, and now sits just above the recent swing low at 0.8474. The break coincides with renewed euro pressure and fading intraday bullish momentum across cross pairs.
With the RSI turning lower and price unable to sustain rallies, market sentiment has shifted firmly in favor of the bears. The current move puts EUR/GBP at risk of a full retracement to its prior low. Unless 0.8474 holds as a reaction zone, further downside may be unavoidable.
📈 TECHNICAL ANALYSIS
Key Support and Resistance Levels
The immediate support zone lies at 0.8474, the prior swing low and the final barrier before a full 100% retracement at 0.8461. A decisive break of 0.8474 would confirm a full structural failure and open the path to fresh lows. On the upside, the 78.6% retracement at 0.8487 now becomes immediate resistance. Beyond that, the 61.8% level at 0.8492and the 50% retracement at 0.8501 are the next technical layers of resistance that would need to be reclaimed to neutralize current selling pressure.
Moving Averages and Dynamic Price Action
Price is trading below both the 50-period and 200-period weighted moving averages, with the 50-WMA now sloping downward. This alignment confirms short-term bearish control and suggests that sellers are continuing to pressure any recovery attempts. Unless EUR/GBP can break back above the 0.8490–0.8500 range, the technical tone remains weak. The 200-WMA remains overhead and is no longer offering support — its slope has flattened, indicating a neutral to bearish shift in trend structure.
RSI Momentum and Bearish Pressure
The 14-period RSI has dropped sharply from near 60 to the 35 zone, reflecting an acceleration in bearish pressure. There is no divergence to signal reversal and no bullish momentum rebound in sight. If RSI falls below 30, it will confirm oversold conditions, but until a reaction materializes, the trend remains vulnerable. A rebound in RSI above 45, combined with price action above 0.8490, would be the first signal of exhaustion or base formation.
Candlestick Behavior and Price Action Clarity
Recent candlesticks are clearly bearish, with strong bodies and very limited lower wicks, indicating low demand near lows and a lack of buying interest. The breakdown below 0.8487 was confirmed on a clean candle close, and the market has not produced any significant reaction since. No bullish reversal patterns such as pin bars or engulfing candles are visible. The lack of basing behavior around 0.8474 suggests bears remain in control of short-term direction.
Chart Structure and Breakdown Formation
The structure reflects a complete failure to hold higher retracement zones, with price collapsing below the 61.8%, 78.6%, and now approaching a 100% retracement. After repeated rejections near 0.8522 and 0.8511, the market reversed decisively, forming a sequence of lower highs and lower lows. The breakdown through key Fibonacci levels has left EUR/GBP vulnerable to trend extension unless buyers step in near 0.8474. A reclaim of 0.8490 would be the first sign of stabilization.
Fibonacci Retracement and Extension Levels
The Fibonacci retracement grid from the May 6 low at 0.8461 to the May 7 high at 0.8540 is nearly fully retraced. The failure to hold the 61.8% retracement at 0.8492, and then the 78.6% retracement at 0.8487, highlights bearish strength. Price is now testing 0.8474, the swing low before the Fib leg began. If broken, a full retracement to 0.8461becomes highly likely. Below that, bearish extension levels would need to be projected separately, with the 0.8440–0.8420 zone likely next in play. Bulls must first reclaim 0.8490–0.8500 to interrupt this sequence.
🔍 MARKET OUTLOOK & TRADING SCENARIOS
Bullish Scenario
A rebound from 0.8474, supported by RSI climbing above 45 and price regaining 0.8490, would hint at base formation. Reclaiming the 50-WMA and pushing toward 0.8501 would be needed to fully neutralize current bearish pressure.
Neutral Scenario
Price consolidates between 0.8474 and 0.8490, suggesting short-term indecision as RSI stabilizes and buyers absorb supply. Volume fades, candles flatten, and the market awaits direction.
Bearish Scenario
A decisive break below 0.8474, confirmed by continued RSI weakness and candle closes near lows, would trigger another leg lower toward 0.8461. If no support emerges there, bearish momentum could extend further.
💼 TRADING CONSIDERATIONS
Short sellers remain in control beneath 0.8490, with triggers near 0.8474 and 0.8461. Bullish entries are only justified on clear reclaim of moving averages and a strong RSI recovery. Until then, sellers are expected to fade rebounds.
🏁 CONCLUSION
EUR/GBP has broken below the 78.6% retracement at 0.8487 and now tests the final support at 0.8474. With RSI weakening, price trading below both WMAs, and no reaction from buyers yet, the bears remain firmly in control. A full retracement to 0.8461 is now within reach unless the 0.8474 zone provides a decisive rebound.
⚠️ DISCLAIMER
This analysis is for informational purposes only and does not constitute financial advice. Always consult with a licensed financial professional before making trading decisions.


