
📊 MARKET OVERVIEW
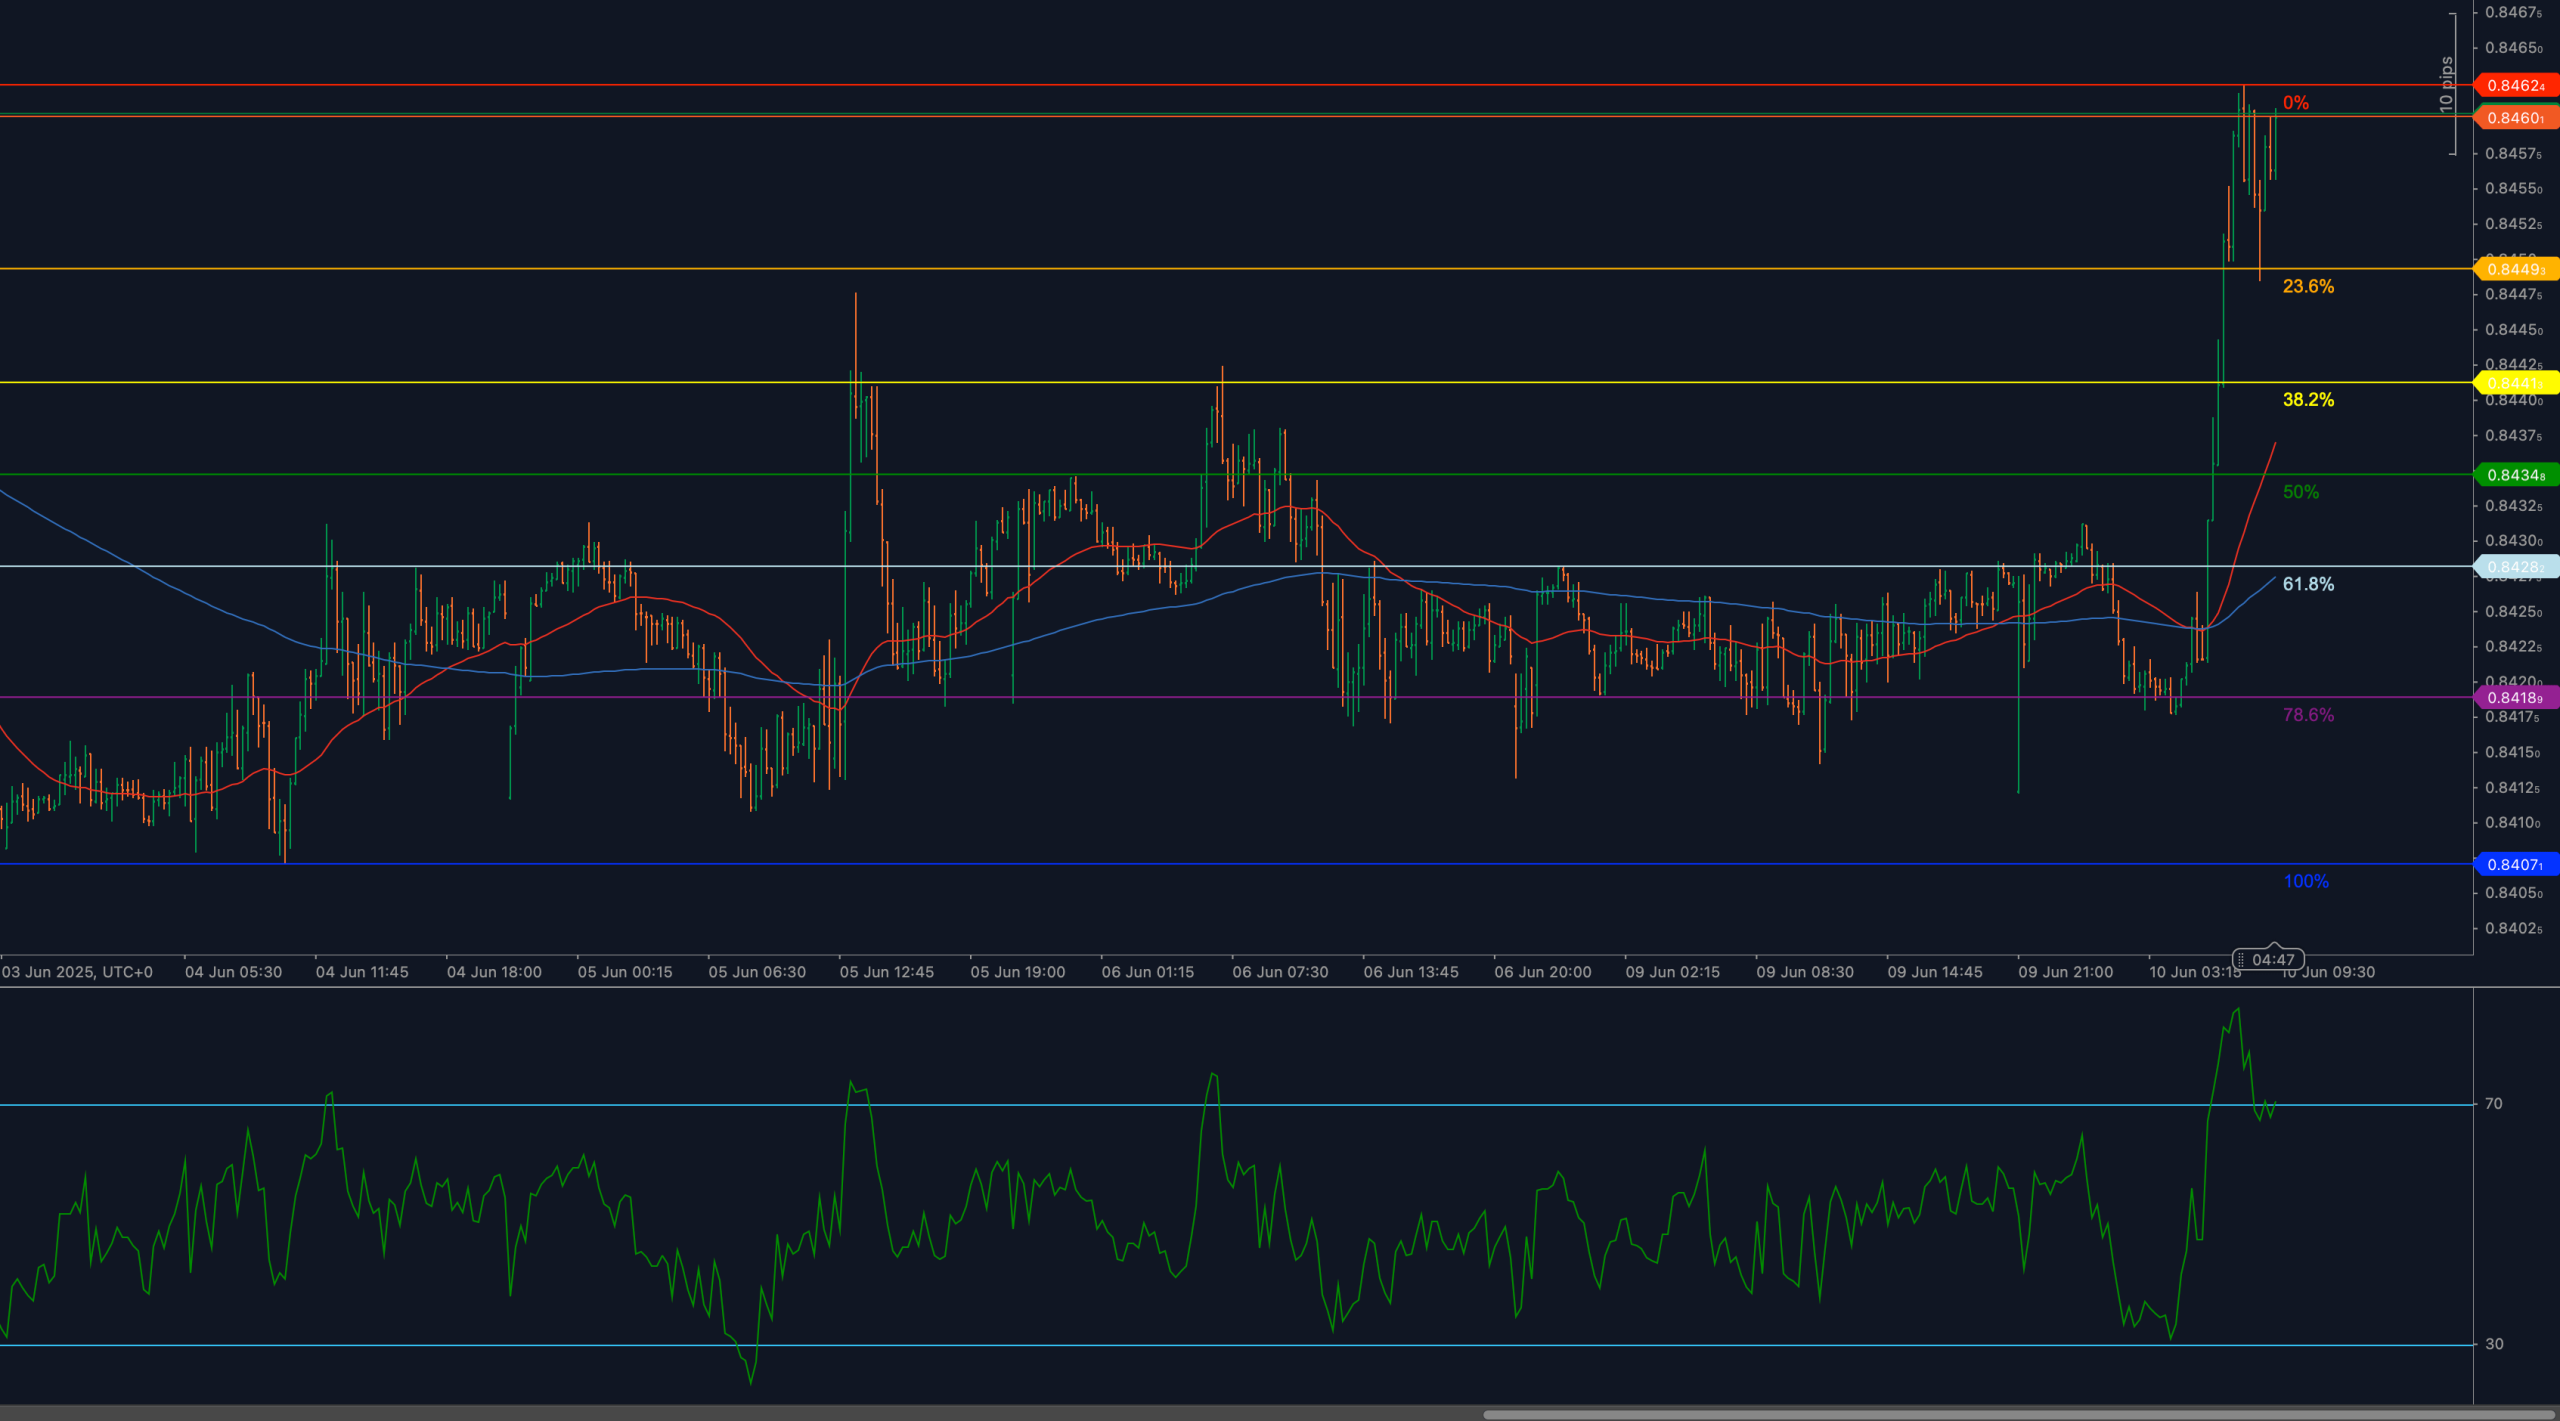
EUR/GBP has erupted to the upside, surging through multiple resistance zones and pushing into 0.8462 — the 0% Fibonacci projection from its most recent swing structure. This move follows a prolonged consolidation phase and an impulsive breakout from beneath the 0.8420 zone. The sudden acceleration has caught many traders off guard, with the rally carrying price beyond the 23.6% and 38.2% retracement levels in a single move.
While the breakout is technically significant, the RSI has spiked into overbought territory, suggesting the rally may need to cool before further gains can be sustained. Nevertheless, the structure has shifted firmly in favor of the bulls, and as long as price holds above former breakout levels, dips are likely to be bought.
📈 TECHNICAL ANALYSIS
Key Support and Resistance Levels
The immediate resistance now lies at 0.8462 — the projected peak of this recent breakout leg. If bulls can push decisively above this level, the next phase would be characterized by Fibonacci extension targets rather than retracement zones. To the downside, key support is now established at 0.8440, where the 23.6% Fibonacci retracement is aligned with prior structural resistance. A further layer of support rests at 0.8430, marking the 38.2% retracement, and should act as a buffer in the event of near-term pullback.
If price drops below 0.8430, the 0.8420 region — near the 50% retracement — becomes critical. A close beneath this zone would suggest the breakout has failed and would realign the structure back into a broader range.
Moving Averages and Dynamic Price Action
Price has reclaimed and stretched far above both the 50-period and 200-period weighted moving averages, which were previously acting as resistance in the mid-0.8420s. Both moving averages are now turning higher, with the 50-WMA showing a sharp upward slope and beginning to distance itself from the 200-WMA — an early sign of a bullish crossover forming.
This alignment confirms bullish control over short-term trend dynamics. A sustained hold above both averages — especially if they begin to compress and act as rising support — would further validate the breakout structure.
RSI Momentum and Bullish Strength
The 14-period RSI has surged past 70 and is now holding near overbought territory, currently around 74. This reading reflects intense bullish momentum, but it also warns of short-term exhaustion risk. If RSI begins to roll over and diverge from price, a corrective pullback could emerge toward the breakout zone.
On the other hand, if RSI stabilizes above 60–65 and price consolidates just beneath the highs, it would confirm a healthy momentum regime. A sharp rejection in RSI back below 60 would be the first sign of failure risk in this rally.
Candlestick Behavior and Price Action Clarity
Recent candlesticks are large-bodied and show strong directional commitment. The surge above 0.8430 was accompanied by wide bullish candles with minimal upper wicks, confirming strong breakout pressure. Current candles near the 0.8460 zone are narrowing slightly, showing signs of absorption — a possible indication of initial profit-taking or resistance absorption.
A bearish engulfing pattern or long upper wick near this zone would signal early exhaustion. If the pair prints small-bodied candles above 0.8440, it may suggest a continuation base forming.
Chart Structure and Breakout Formation
The overall chart structure reflects a classic breakout from multi-session range compression. After spending most of the past week coiling near the 0.8415–0.8430 range, the pair staged a strong breakout with momentum. This impulsive leg has now approached the technical ceiling of the move, and the structure suggests either a continuation toward extensions or a pullback to retest broken resistance.
Price remains in a valid trend leg as long as it stays above 0.8430. If the current move fails, this area will serve as the structural pivot to watch. A break and hold beneath 0.8420 would negate the breakout and set up a full retracement.
Fibonacci Retracement and Extension Levels
The Fibonacci retracement grid drawn from the recent low near 0.8407 to the high at 0.8462 frames the active structure. Price has cleanly sliced through the 23.6% and 38.2% retracement levels at 0.8440 and 0.8430 respectively. These now act as structural supports in the event of a pullback. The 50% retracement at 0.8420 is a key confirmation level — a close below this point would invalidate the bullish move.
If the current advance resumes above 0.8462, Fibonacci extensions at 0.8474 (1.272) and 0.8488 (1.618) come into play. These targets would define the next breakout leg and serve as possible exit zones for momentum traders.
🔍 MARKET OUTLOOK & TRADING SCENARIOS
Bullish Scenario
If price holds above 0.8440 and RSI stabilizes near 70, another breakout through 0.8462 could follow. In this case, traders will look toward 0.8474 and 0.8488 as the next technical targets.
Neutral Scenario
Sideways movement between 0.8430 and 0.8462, with RSI staying in the 60–70 band, would indicate consolidation at the top. This could offer a launchpad for a continuation move or a staging ground for a broader retracement.
Bearish Scenario
A failure to hold 0.8430 would be the first sign of weakness. A break below 0.8420 — the 50% retracement — would confirm reversal risk and shift the focus toward 0.8410 and 0.8407.
💼 TRADING CONSIDERATIONS
Momentum traders may look to trail stops below 0.8440, protecting gains from the breakout. New longs should be cautious entering near 0.8462 unless a confirmed extension occurs. Short setups may emerge only on failure back below 0.8430 with bearish candle confirmation and RSI divergence.
🏁 CONCLUSION
EUR/GBP has executed a powerful breakout above key resistance, surging toward 0.8462. With RSI now in overbought territory, the setup remains bullish but vulnerable to short-term consolidation or correction. Price must stay above 0.8430–0.8440 to preserve breakout structure. A continuation above 0.8462 would activate new Fibonacci extension targets.
⚠️ DISCLAIMER
This analysis is for informational purposes only and does not constitute financial advice. Always consult with a licensed financial professional before making trading decisions.


