
The EUR/GBP pair has rebounded to 0.8323 resistance, showing signs of renewed bullish momentum. However, sellers may step in at this key level to limit further gains.
Technical Analysis
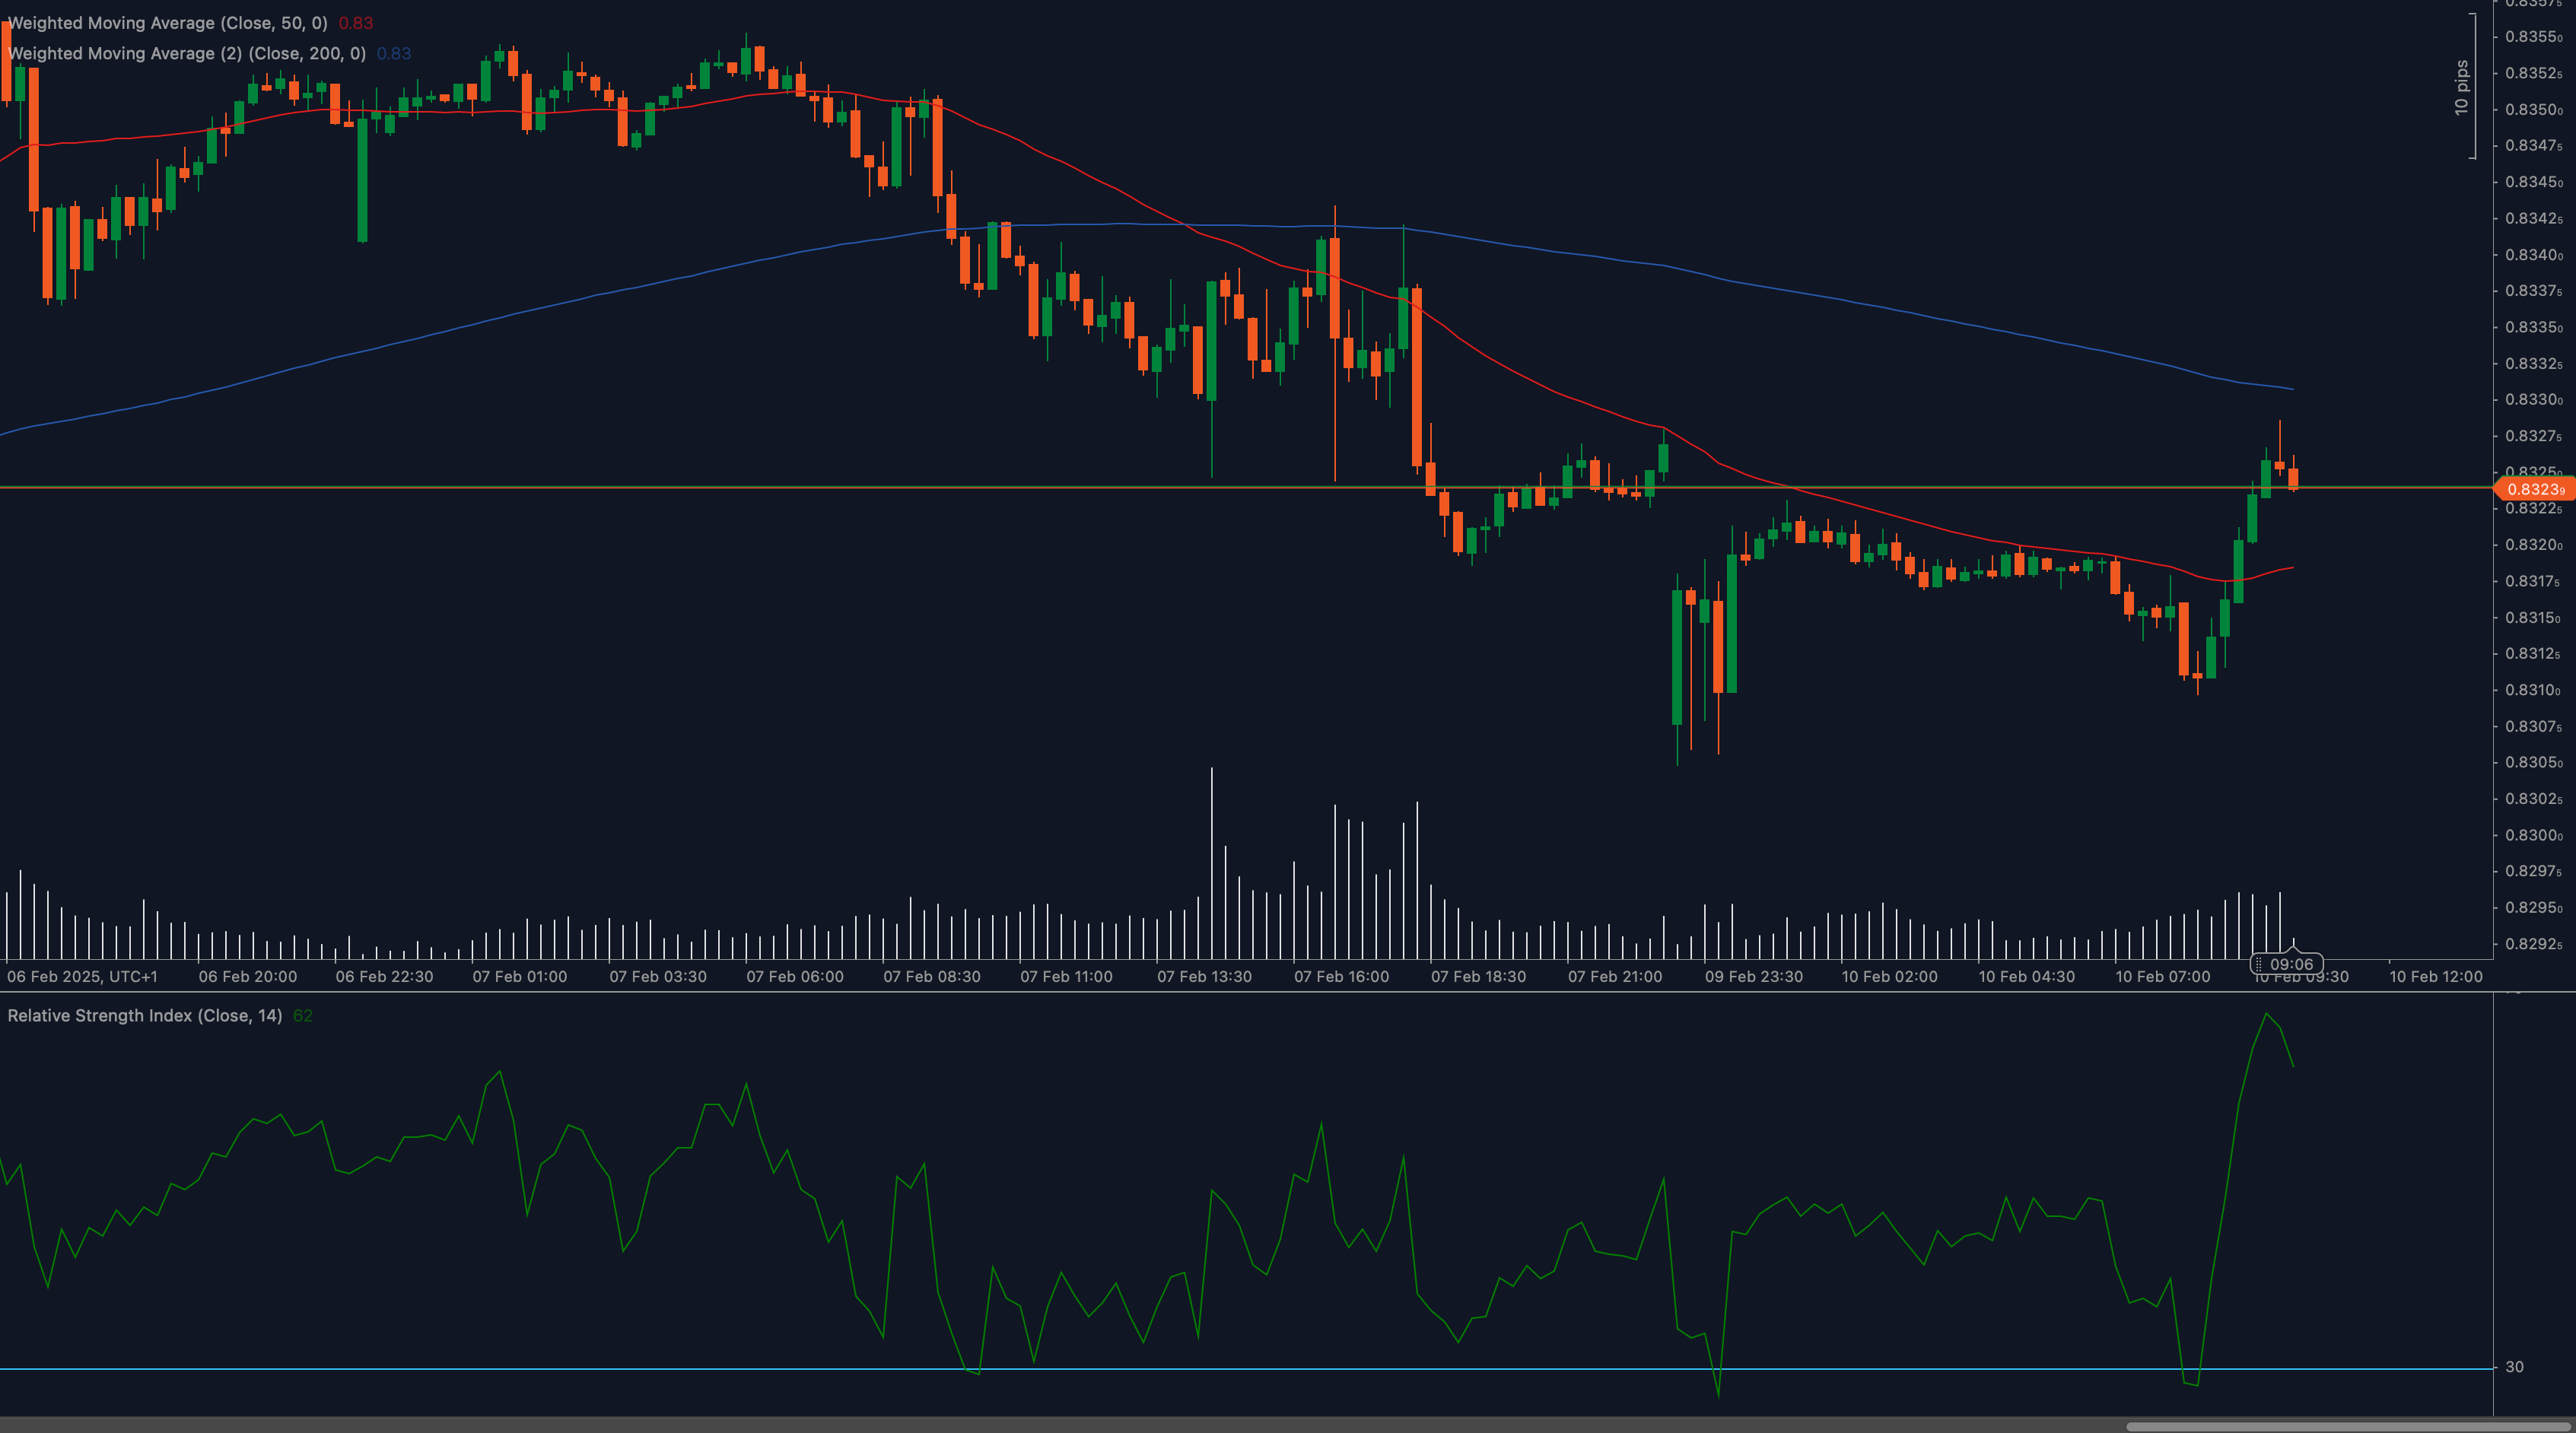
📉 Weighted Moving Averages Show Cautious Recovery
The 50 Weighted Moving Average (WMA) at 0.83 remains below the 200 WMA, suggesting that the broader downtrend is still intact despite the recovery. A break above the 200 WMA would indicate a stronger bullish shift.
📊 RSI Signals Strengthening Momentum
The Relative Strength Index (RSI) is at 62, suggesting that buyers are gaining control. If RSI continues rising above 65, it could indicate further upside potential, while a drop below 55 RSI may suggest fading momentum.
🔎 Resistance and Support Levels in Focus
EUR/GBP is testing a critical level, and traders are closely watching for a breakout or rejection.
Key Levels to Watch
Support Levels:
- 0.8300: Immediate support after the recent rebound.
- 0.8280: Stronger support if selling pressure resumes.
Resistance Levels:
- 0.8323: Immediate resistance currently capping further upside.
- 0.8340: Next key level if the breakout is confirmed.
Fundamental Drivers
EUR/GBP remains influenced by monetary policy expectations, economic data releases, and Brexit-related developments. Traders are closely monitoring upcoming UK and Eurozone economic reports for further direction.
Outlook
A confirmed breakout above 0.8323 could push EUR/GBP toward 0.8340, while failure to hold gains may lead to a retest of 0.8300 or lower.
Traders should monitor price action and fundamental developments to confirm the next trend direction.


