
📊 MARKET OVERVIEW
The EURAUD currency pair has exhibited remarkable strength in recent trading sessions, breaking decisively above the psychological 1.6660 resistance level. This significant technical development comes amid shifting market dynamics between the European and Australian economies, with diverging monetary policy expectations playing a crucial role in driving this forex pair’s movement. The uptrend has been reinforced by multiple technical confirmations, including golden cross formation between key moving averages and strengthening momentum indicators that suggest continued bullish pressure in the near term.
Current price action demonstrates that EURAUD is in a strong uptrend channel, with buyers maintaining control above both the 50-day and 200-day moving averages. The recent breakout above 1.6660 represents a significant technical milestone that could potentially open the door for further advances toward the 1.6700-1.6750 zone. Trading volume has shown noticeable increase during the recent bullish moves, providing additional confirmation that this upward momentum may have staying power beyond a mere technical bounce.
📈 TECHNICAL ANALYSIS
What Are the Key Support and Resistance Levels for EURAUD?
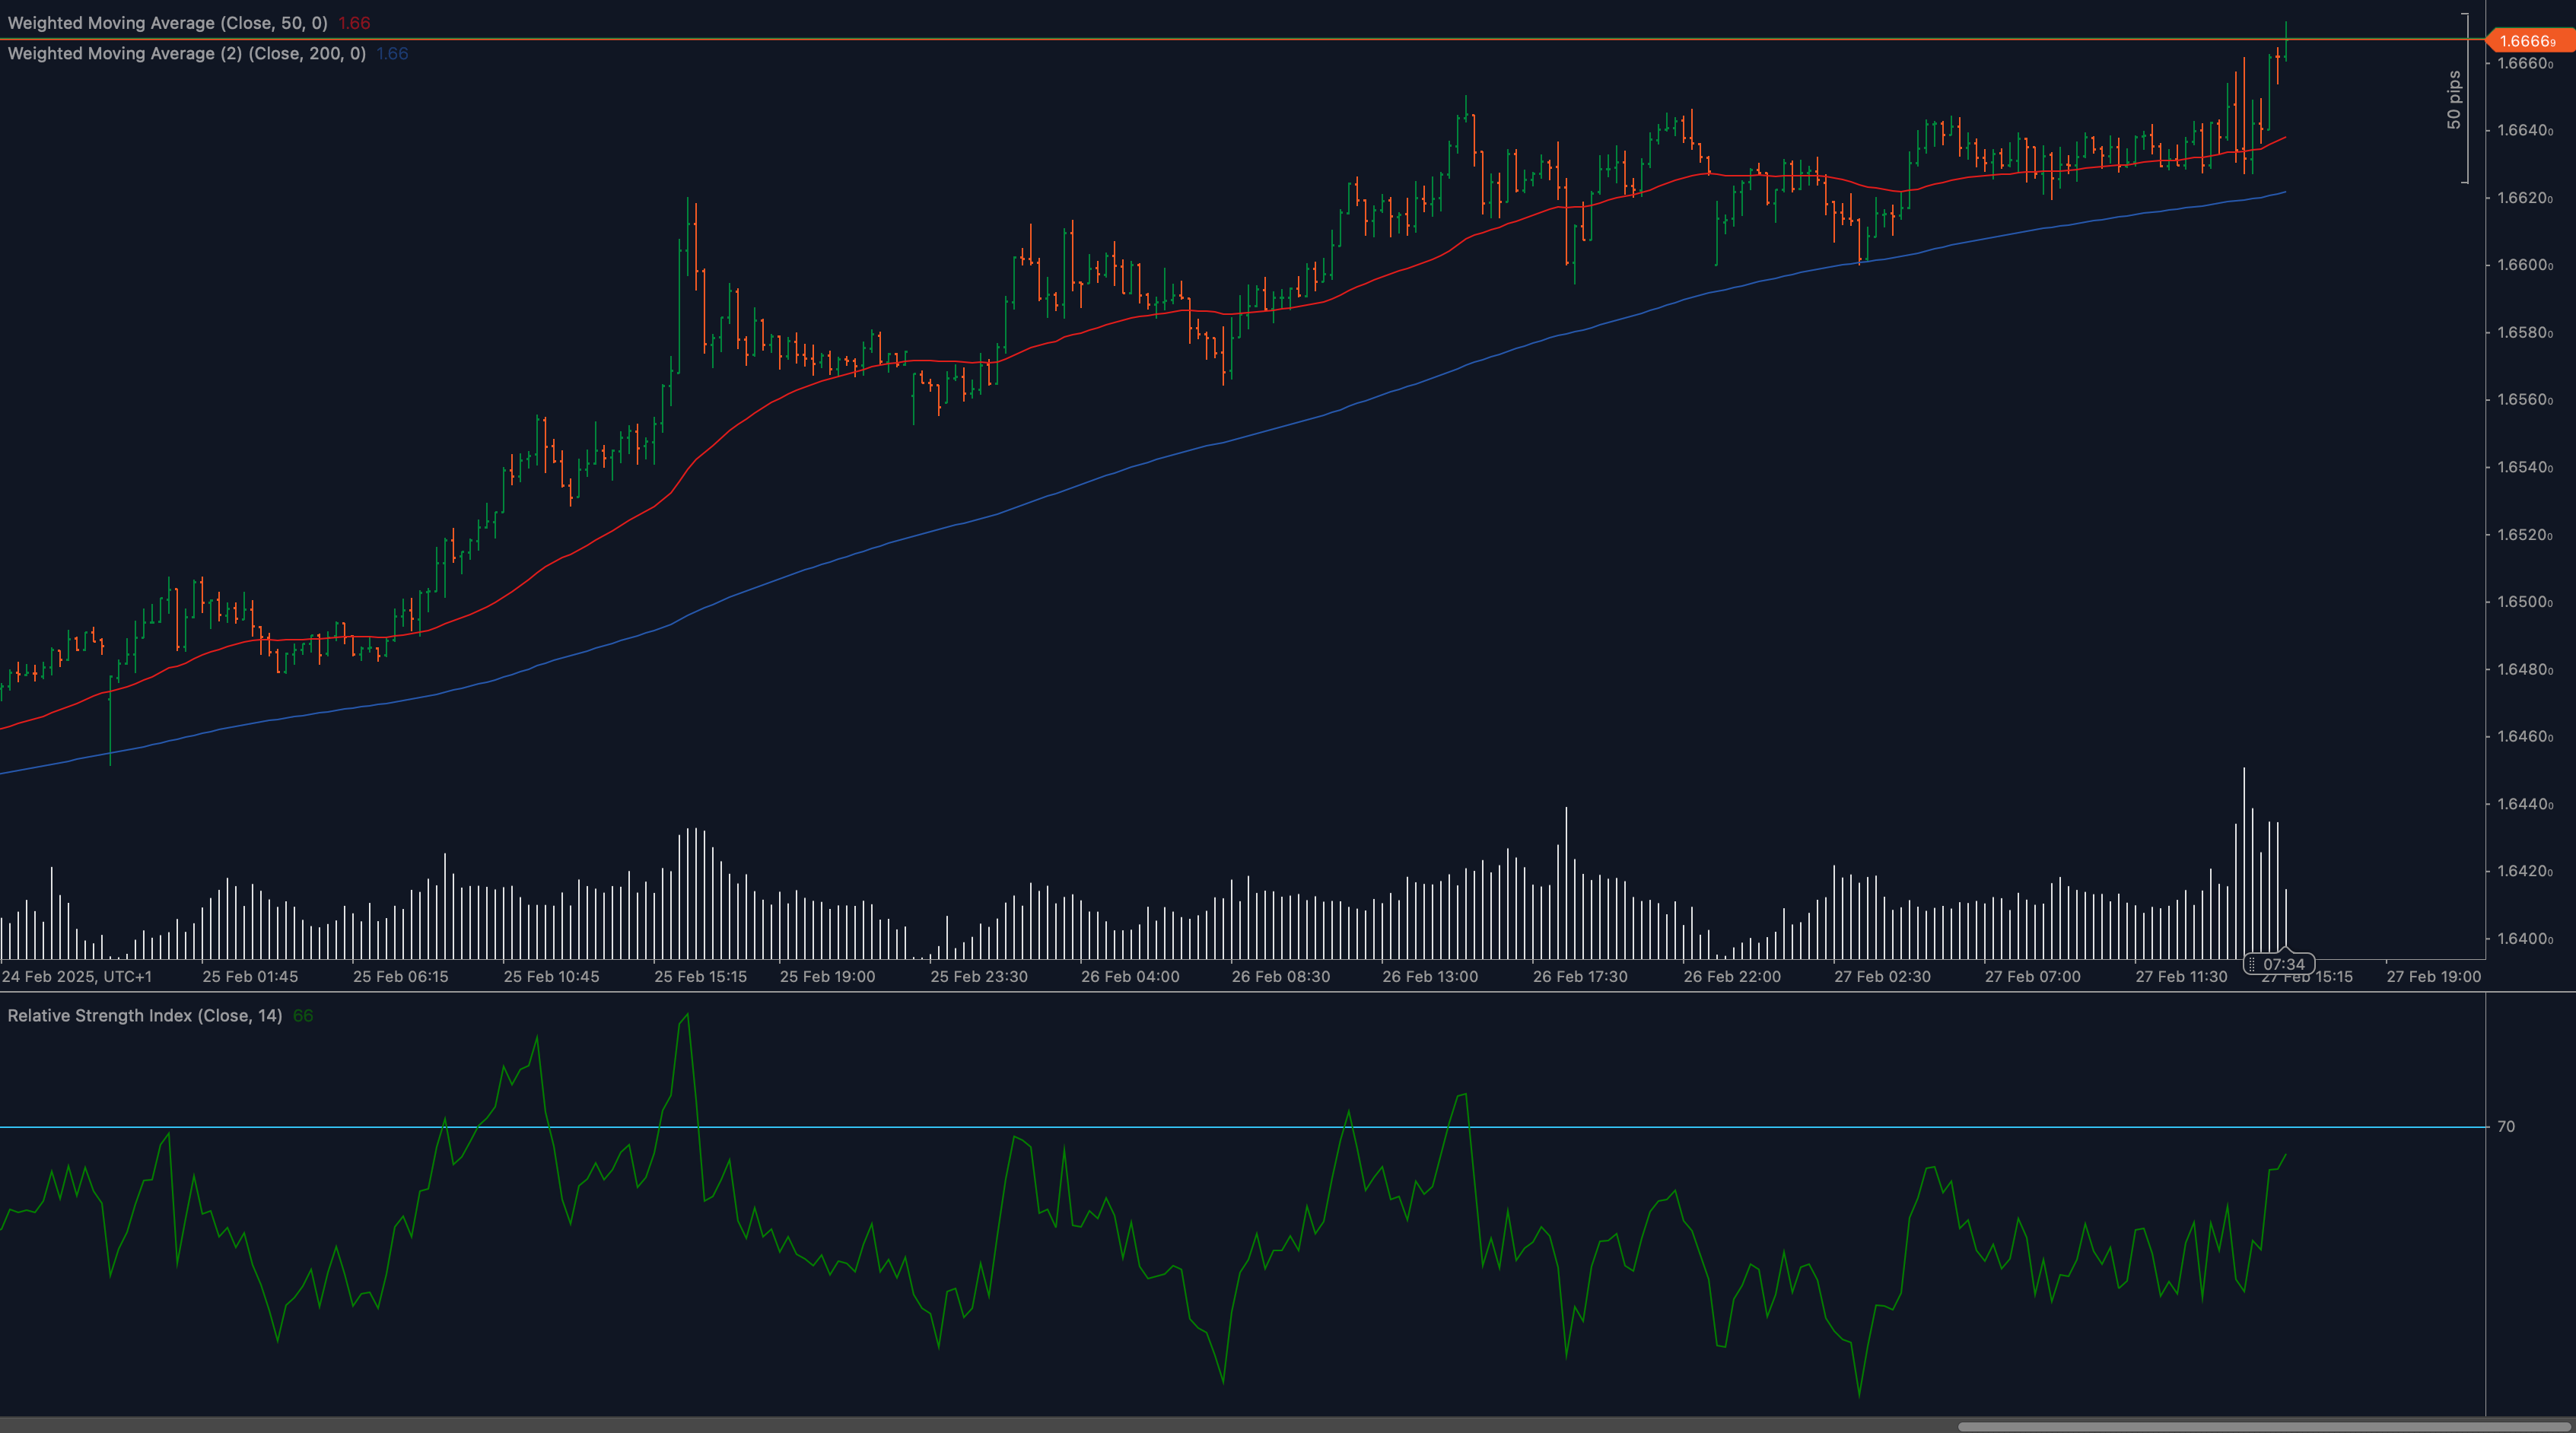
The EURAUD pair has established several critical technical levels that traders should monitor closely. The most significant recent development is the breakthrough above 1.6660, which represents a major resistance level that has now potentially converted to support. This price action demonstrates the bullish control currently dominating this currency pair. Below current price action, the 50-day moving average (currently around 1.6635) provides the first layer of dynamic support, followed by the more significant 200-day moving average (around 1.6580) which forms a stronger foundation for the ongoing uptrend.
Looking at resistance levels, the immediate hurdle appears at the 1.6700 psychological level, followed by potential resistance at 1.6750 based on previous market structure. The RSI indicator reading at 65 shows strong momentum without yet reaching overbought territory, suggesting there may be room for additional upside before a significant correction or consolidation phase begins. The golden cross formation (50 MA crossing above 200 MA) visible on the chart provides a classic bullish confirmation signal that many technical traders recognize as a sign of continued upward momentum.
Price action analysis reveals a series of higher highs and higher lows formed over the analyzed period, confirming the strength of the uptrend. Candlestick patterns show several bullish engulfing formations during recent advances, particularly at key support levels, indicating strong buying pressure emerging whenever the pair experiences minor pullbacks. The consistent respect for the 50-day moving average as dynamic support further reinforces the bullish technical structure currently in place.
How Do Moving Averages Support the Current EURAUD Trend?
The relationship between the 50-day and 200-day moving averages provides compelling evidence for the strength of the current uptrend. The 50-day moving average (red line) is positioned clearly above the 200-day moving average (blue line), creating the golden cross formation that typically signals a strong bullish market. This moving average alignment serves as a dynamic support zone that has repeatedly contained pullbacks and provided a launching point for new advances.
The increasing separation between these two moving averages indicates accelerating momentum in the uptrend. Price action maintaining position above both moving averages confirms that buyers remain in control of the market structure. The 50-day moving average has consistently provided support during minor retracements, demonstrating its importance as a technical reference point for traders. The slope of both moving averages is positive, with the 50-day MA showing a steeper angle, which typically indicates strengthening bullish momentum in the intermediate term.
What Does the RSI Indicator Reveal About EURAUD Momentum?
The Relative Strength Index (RSI) reading of 65 indicates strong positive momentum without yet reaching the overbought threshold of 70. This suggests that while the pair has made significant advances, there remains potential for continued upside before exhaustion signals appear. The RSI has maintained readings above the midpoint (50) during recent price action, confirming the underlying bullish bias in this market.
The RSI pattern shows a series of higher lows that correlate with the price action’s higher lows, demonstrating technical congruence between momentum and price development. No significant bearish divergence is present at current levels, which would otherwise suggest weakening momentum despite rising prices. The RSI has shown respect for previous resistance levels around 70, typically pulling back from this zone before resuming its upward trajectory alongside price action.
🔍 MARKET OUTLOOK & TRADING SCENARIOS
Bullish Scenario
In the bullish case, EURAUD continues its upward trajectory after consolidating above the 1.6660 breakthrough level. Momentum carries the pair toward the 1.6700 psychological resistance, potentially extending toward 1.6750 if positive momentum accelerates. This scenario is supported by the golden cross formation and positive RSI readings. Traders implementing a bullish strategy should consider entries on pullbacks toward the 50-day moving average, with stop losses placed below this dynamic support. The target-to-risk ratio remains favorable in this scenario, with potential for 1:2 or better risk-reward setups depending on entry precision.
Neutral Scenario
The neutral outlook involves EURAUD entering a consolidation phase after the recent advance, trading in a range between 1.6620 and 1.6680 as the market digests recent gains. This scenario could involve price action respecting both the recent breakthrough level and the 50-day moving average as boundaries for a newly established trading range. In this case, range-trading strategies become appropriate, with entries near range boundaries and profit targets aimed at the opposing boundary. The consolidation period would likely be characterized by declining volume and narrowing RSI oscillations around the 50-60 level.
Bearish Scenario
Despite the current bullish structure, prudent traders must consider potential reversal scenarios. A bearish shift would initially be signaled by failure to maintain position above the 1.6660 breakthrough level, followed by a decisive break below the 50-day moving average. This scenario could gain momentum if price action subsequently breaks below the 200-day moving average, potentially triggering a deeper correction toward 1.6500. Warning signs for this scenario would include bearish divergence on the RSI and declining trading volumes during price advances. Protective measures should include trailing stops and position size management to limit exposure to potential downside risk.
💼 TRADING CONSIDERATIONS
Implementing a trading strategy for the current EURAUD technical environment requires careful consideration of entry timing, position sizing, and risk management parameters. The clear technical structure provides multiple reference points for constructing a disciplined trading approach. For bullish positions, traders should consider pullbacks to the 50-day moving average or the 1.6660 support (former resistance) as potential entry zones, with stop losses placed 30-50 pips below entry to account for market noise while protecting capital.
Position sizing should reflect the moderate volatility profile of EURAUD, typically ranging between 50-80 pips daily. A conservative approach would limit risk to 1-2% of trading capital per position. Traders should also consider the impact of economic releases affecting both the Eurozone and Australian economies, as these fundamental catalysts can temporarily override technical factors and create volatility spikes. Particular attention should be paid to interest rate decisions, inflation data, and employment figures from both economic regions.
The optimal holding period for positions based on the current technical structure would be medium-term (3-7 days) for trend-following strategies, allowing sufficient time for price action to develop toward targets while avoiding excessive exposure to short-term market noise. Traders should implement a trailing stop loss approach once positions move into profit, using the 50-day moving average as a dynamic reference point for stop adjustment as the trade progresses.
🏁 CONCLUSION
The technical analysis of EURAUD presents a compelling bullish case based on multiple confirming factors, including the golden cross formation, breakthrough above key resistance at 1.6660, and positive momentum readings. The alignment of these technical elements suggests potential for continued upside toward the 1.6700-1.6750 zone in the near term. However, prudent traders should remain vigilant for signs of momentum exhaustion or reversal patterns that could signal a shift in the technical structure.
The most significant support level to monitor is the 50-day moving average, currently providing dynamic support around 1.6635, with the 200-day moving average creating a deeper support zone around 1.6580. These levels provide clear reference points for risk management and potential entry opportunities on pullbacks. Trading strategies should incorporate these technical levels while maintaining appropriate position sizing and risk parameters suited to each trader’s individual risk tolerance and account size.
As with all technical analysis, these projections should be continually reassessed as new price action develops and technical indicators evolve. The most successful approach will involve adapting to changing market conditions while maintaining discipline in applying consistent trading principles based on the identified technical structure.
⚠️ DISCLAIMER:
This analysis is for informational purposes only and should not be considered financial advice. Trading carries risk, and past performance does not guarantee future results. Conduct independent research before making investment decisions. The EURAUD currency pair, like all forex instruments, involves substantial risk of loss and is not suitable for all investors. Consider your experience, investment objectives, financial resources, and risk tolerance carefully before trading.


