
📊 MARKET OVERVIEW
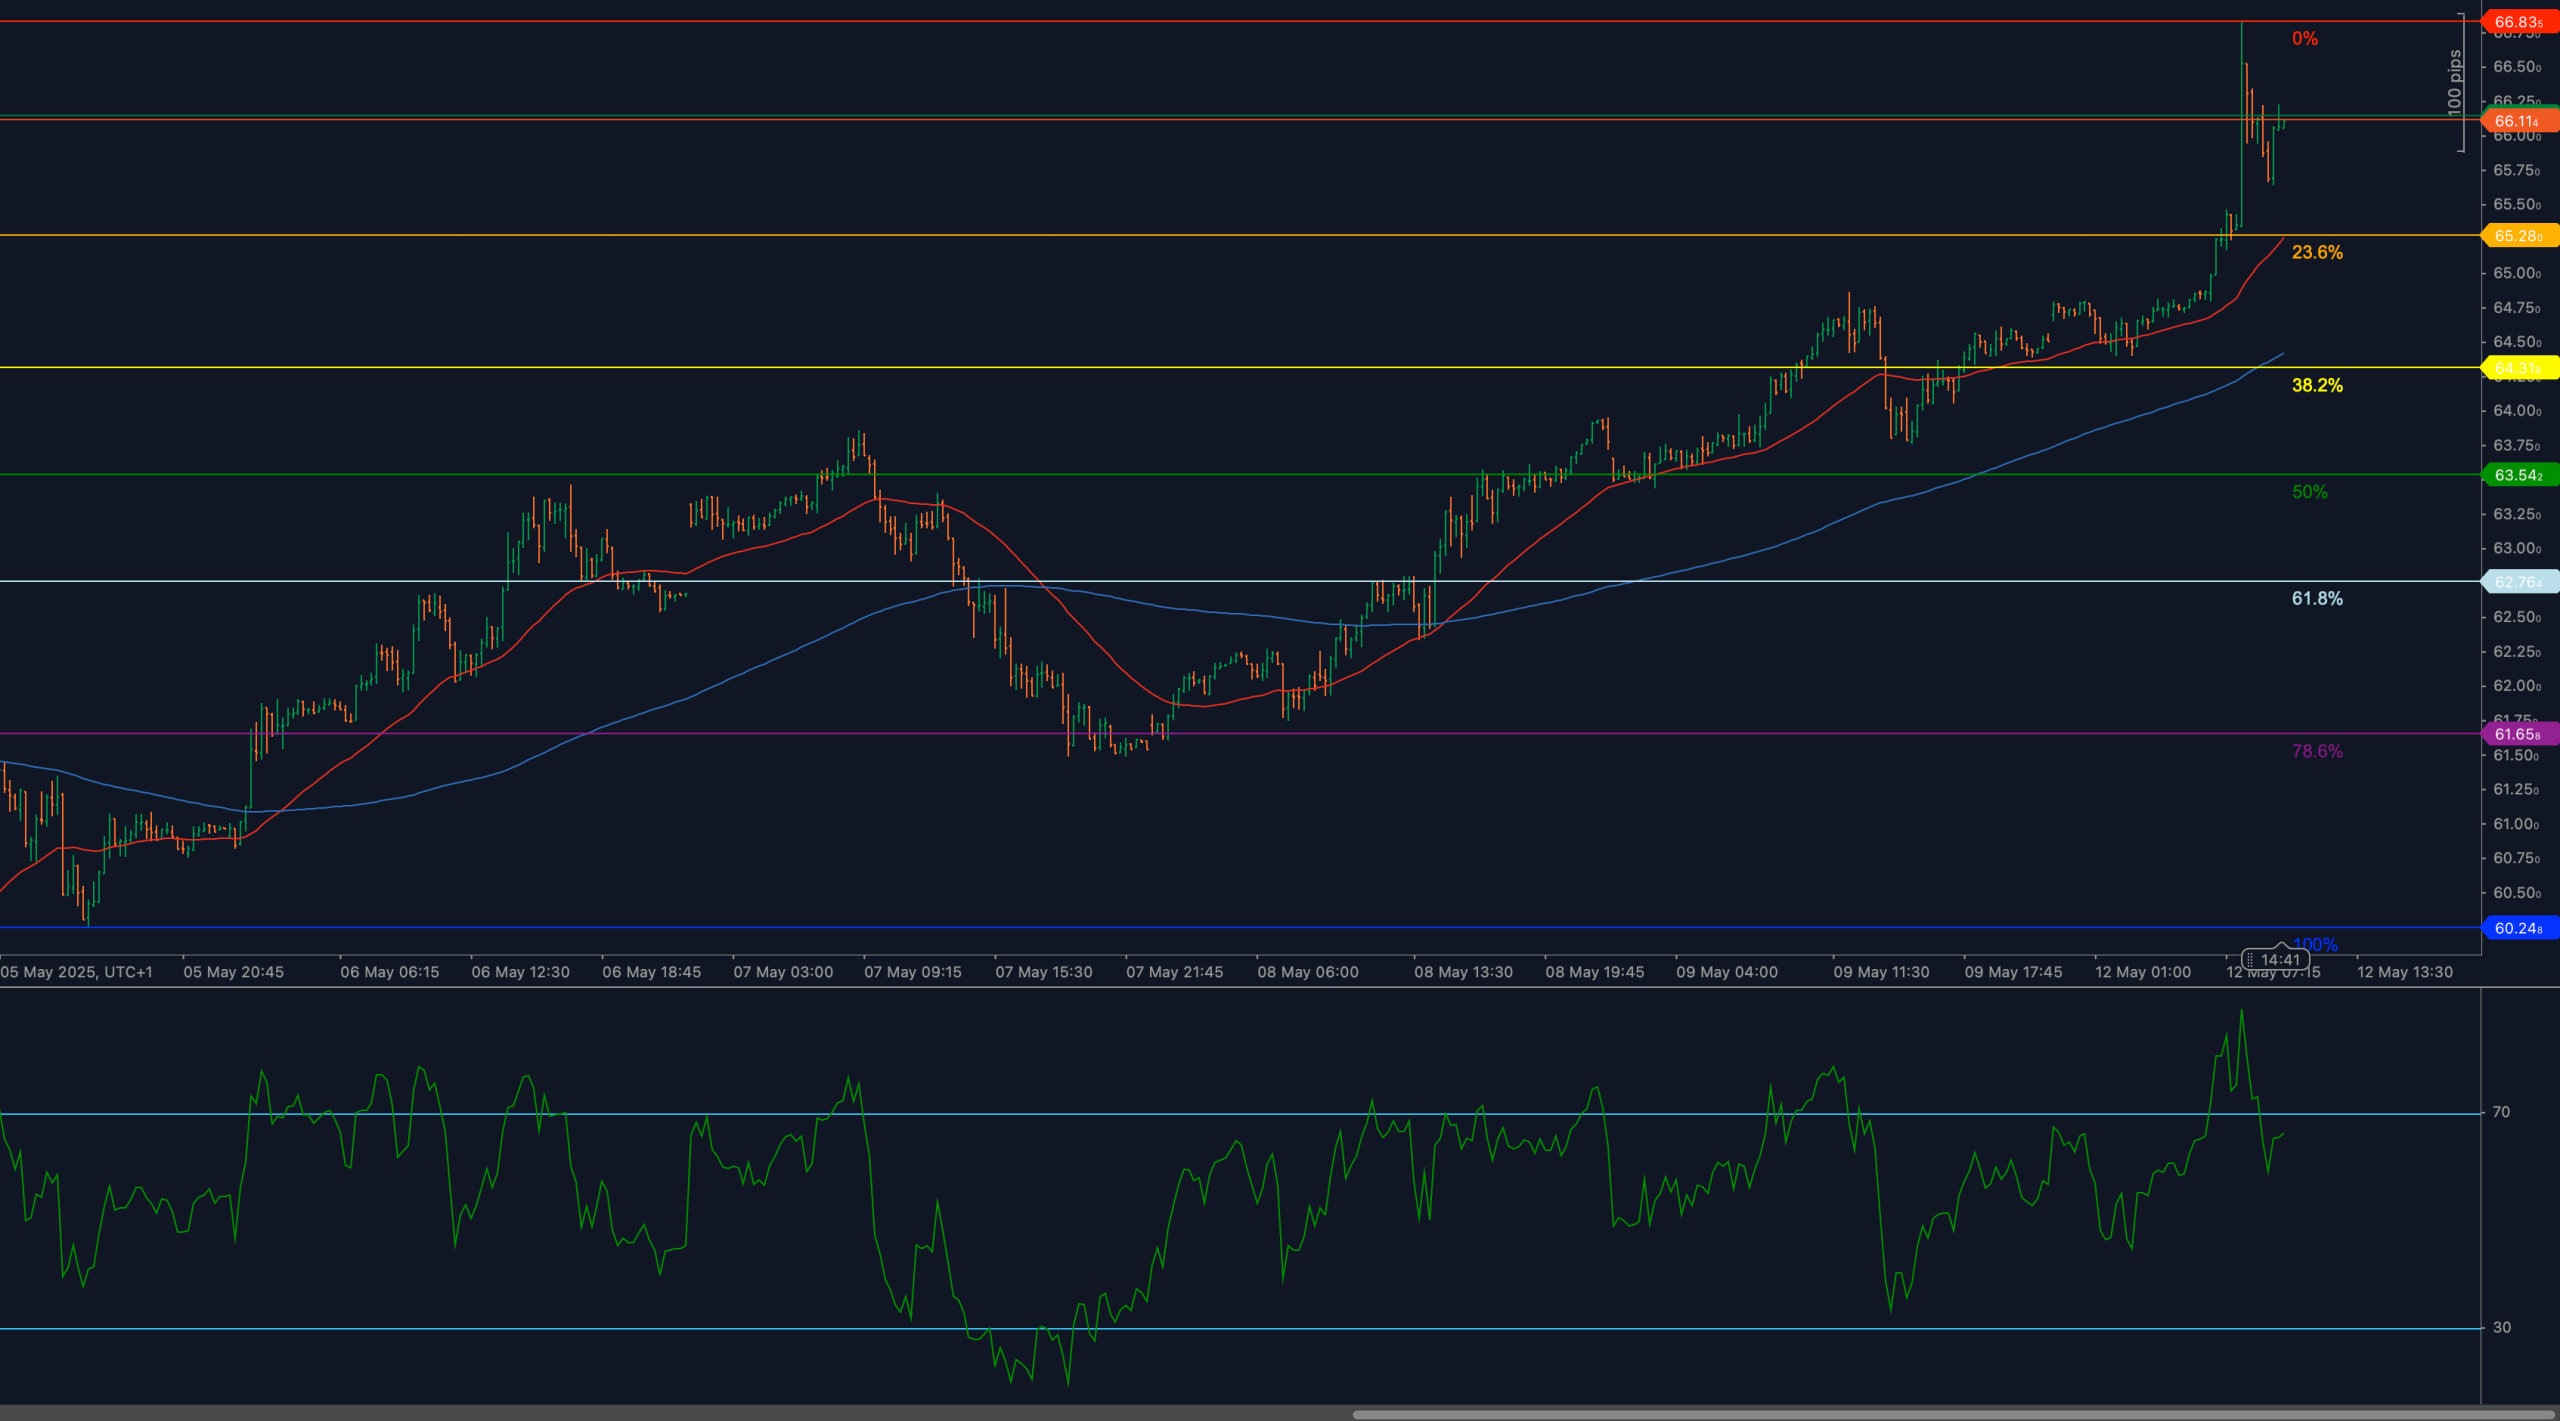
Brent crude oil (UKOIL) has pulled back modestly after a powerful upside leg that brought price from 60.24 to a new local high at 66.88. The surge paused just beneath the 66.11 resistance level, where prior supply capped advances in April. The rally was accompanied by an overbought RSI spike above 70, which has now begun to ease. The short-term outlook remains constructive, but bulls may need to absorb profit-taking before the next breakout attempt.
The move comes as energy markets respond to geopolitical headlines and refined product demand trends. Technically, UKOIL remains in an uptrend, and current price action reflects a healthy pause above key retracement supports.
📈 TECHNICAL ANALYSIS
Key Support and Resistance Levels
The most immediate resistance lies at 66.11, where prior price action rejected in late April. A clean breakout above this level would open the door to a retest of the swing high at 66.88, and possibly extend toward new Fibonacci expansion levels. Support now sits at 65.50, followed by the 23.6% retracement at 65.05. If price fails to hold this zone, deeper support can be found at the 38.2% level at 64.00, and the 50% retracement at 63.54.
Moving Averages and Dynamic Price Action
Price remains above both the 50-period and 200-period weighted moving averages, with the 50-WMA sharply sloped upward. The 200-WMA continues to rise in support, confirming the overall bullish structure. Short-term pullbacks into these moving average zones are likely to attract dip buyers. As long as price remains above 64.00, the medium-term trend remains in favor of the bulls.
RSI Momentum and Bullish Pressure
The 14-period RSI spiked above 70 during the last impulsive move but has since retreated to the 65 region, indicating fading momentum without a full reversal. This suggests a potential consolidation or shallow pullback before trend resumption. If RSI holds above 60, momentum remains structurally bullish. A dip below 50 would mark a shift to corrective behavior.
Candlestick Behavior and Price Action Clarity
Recent candles show rejection near 66.11, with upper wicks and smaller real bodies indicating hesitation. This is consistent with RSI cooling and supply entering the market. Price has not produced bearish engulfing patterns or breakdown structures yet, which suggests the move is a pause rather than reversal. A strong bullish candle above 66.11 would confirm breakout continuation.
Chart Structure and Breakout Formation
The broader chart structure shows a clean impulsive advance from 60.24 to 66.88, followed by the formation of a potential bull flag or ascending wedge. The current pullback appears corrective and is holding above mid-Fibonacci levels. A successful breakout above 66.11 would resume the upward leg. A failure here could send price back into the 64.00–65.00 support range for retesting.
Fibonacci Retracement and Extension Levels
The Fibonacci retracement mapped from 60.24 to 66.88 defines the key structure zones. The 23.6% level at 65.05 has already been tested intraday and is acting as the first support. Below that, 64.00 (38.2%) and 63.54 (50%) offer deeper zones of interest. The 61.8% retracement at 62.76 is the threshold between correction and trend invalidation. If bulls regain momentum and break 66.11, Fibonacci extensions toward 67.60 and beyond would become active.
🔍 MARKET OUTLOOK & TRADING SCENARIOS
Bullish Scenario
If price holds above 65.05 and RSI stabilizes near 65, bulls may initiate a breakout above 66.11, targeting a move through 66.88 and into extension zones. Momentum would be confirmed with RSI rising above 70 again.
Neutral Scenario
Price consolidates between 65.05 and 66.11, building a tight range as RSI remains flat between 55–65. Volume fades and breakout attempts fail, keeping the market in wait-and-see mode.
Bearish Scenario
Failure to hold 65.05, followed by a drop below 64.00, would expose downside toward 63.54 and 62.76, shifting structure toward correction. RSI slipping below 50 would confirm trend fatigue.
💼 TRADING CONSIDERATIONS
Bullish setups favor buying pullbacks near 65.05 with stops under 64.00 and targets near 66.88+. Bears may consider short entries only if price breaks 64.00 with RSI confirmation. Neutral traders can play the 65.00–66.10 range while awaiting direction.
🏁 CONCLUSION
UKOIL remains in an uptrend, with price consolidating below 66.11 resistance after a sharp rally from 60.24. Momentum has eased but remains supportive, and structure is intact above 65.05. A breakout above 66.11 would confirm trend continuation, while failure here could result in a controlled pullback into Fibonacci support.
⚠️ DISCLAIMER
This analysis is for informational purposes only and does not constitute financial advice. Always consult with a licensed financial professional before making trading decisions.


