
📊 MARKET OVERVIEW
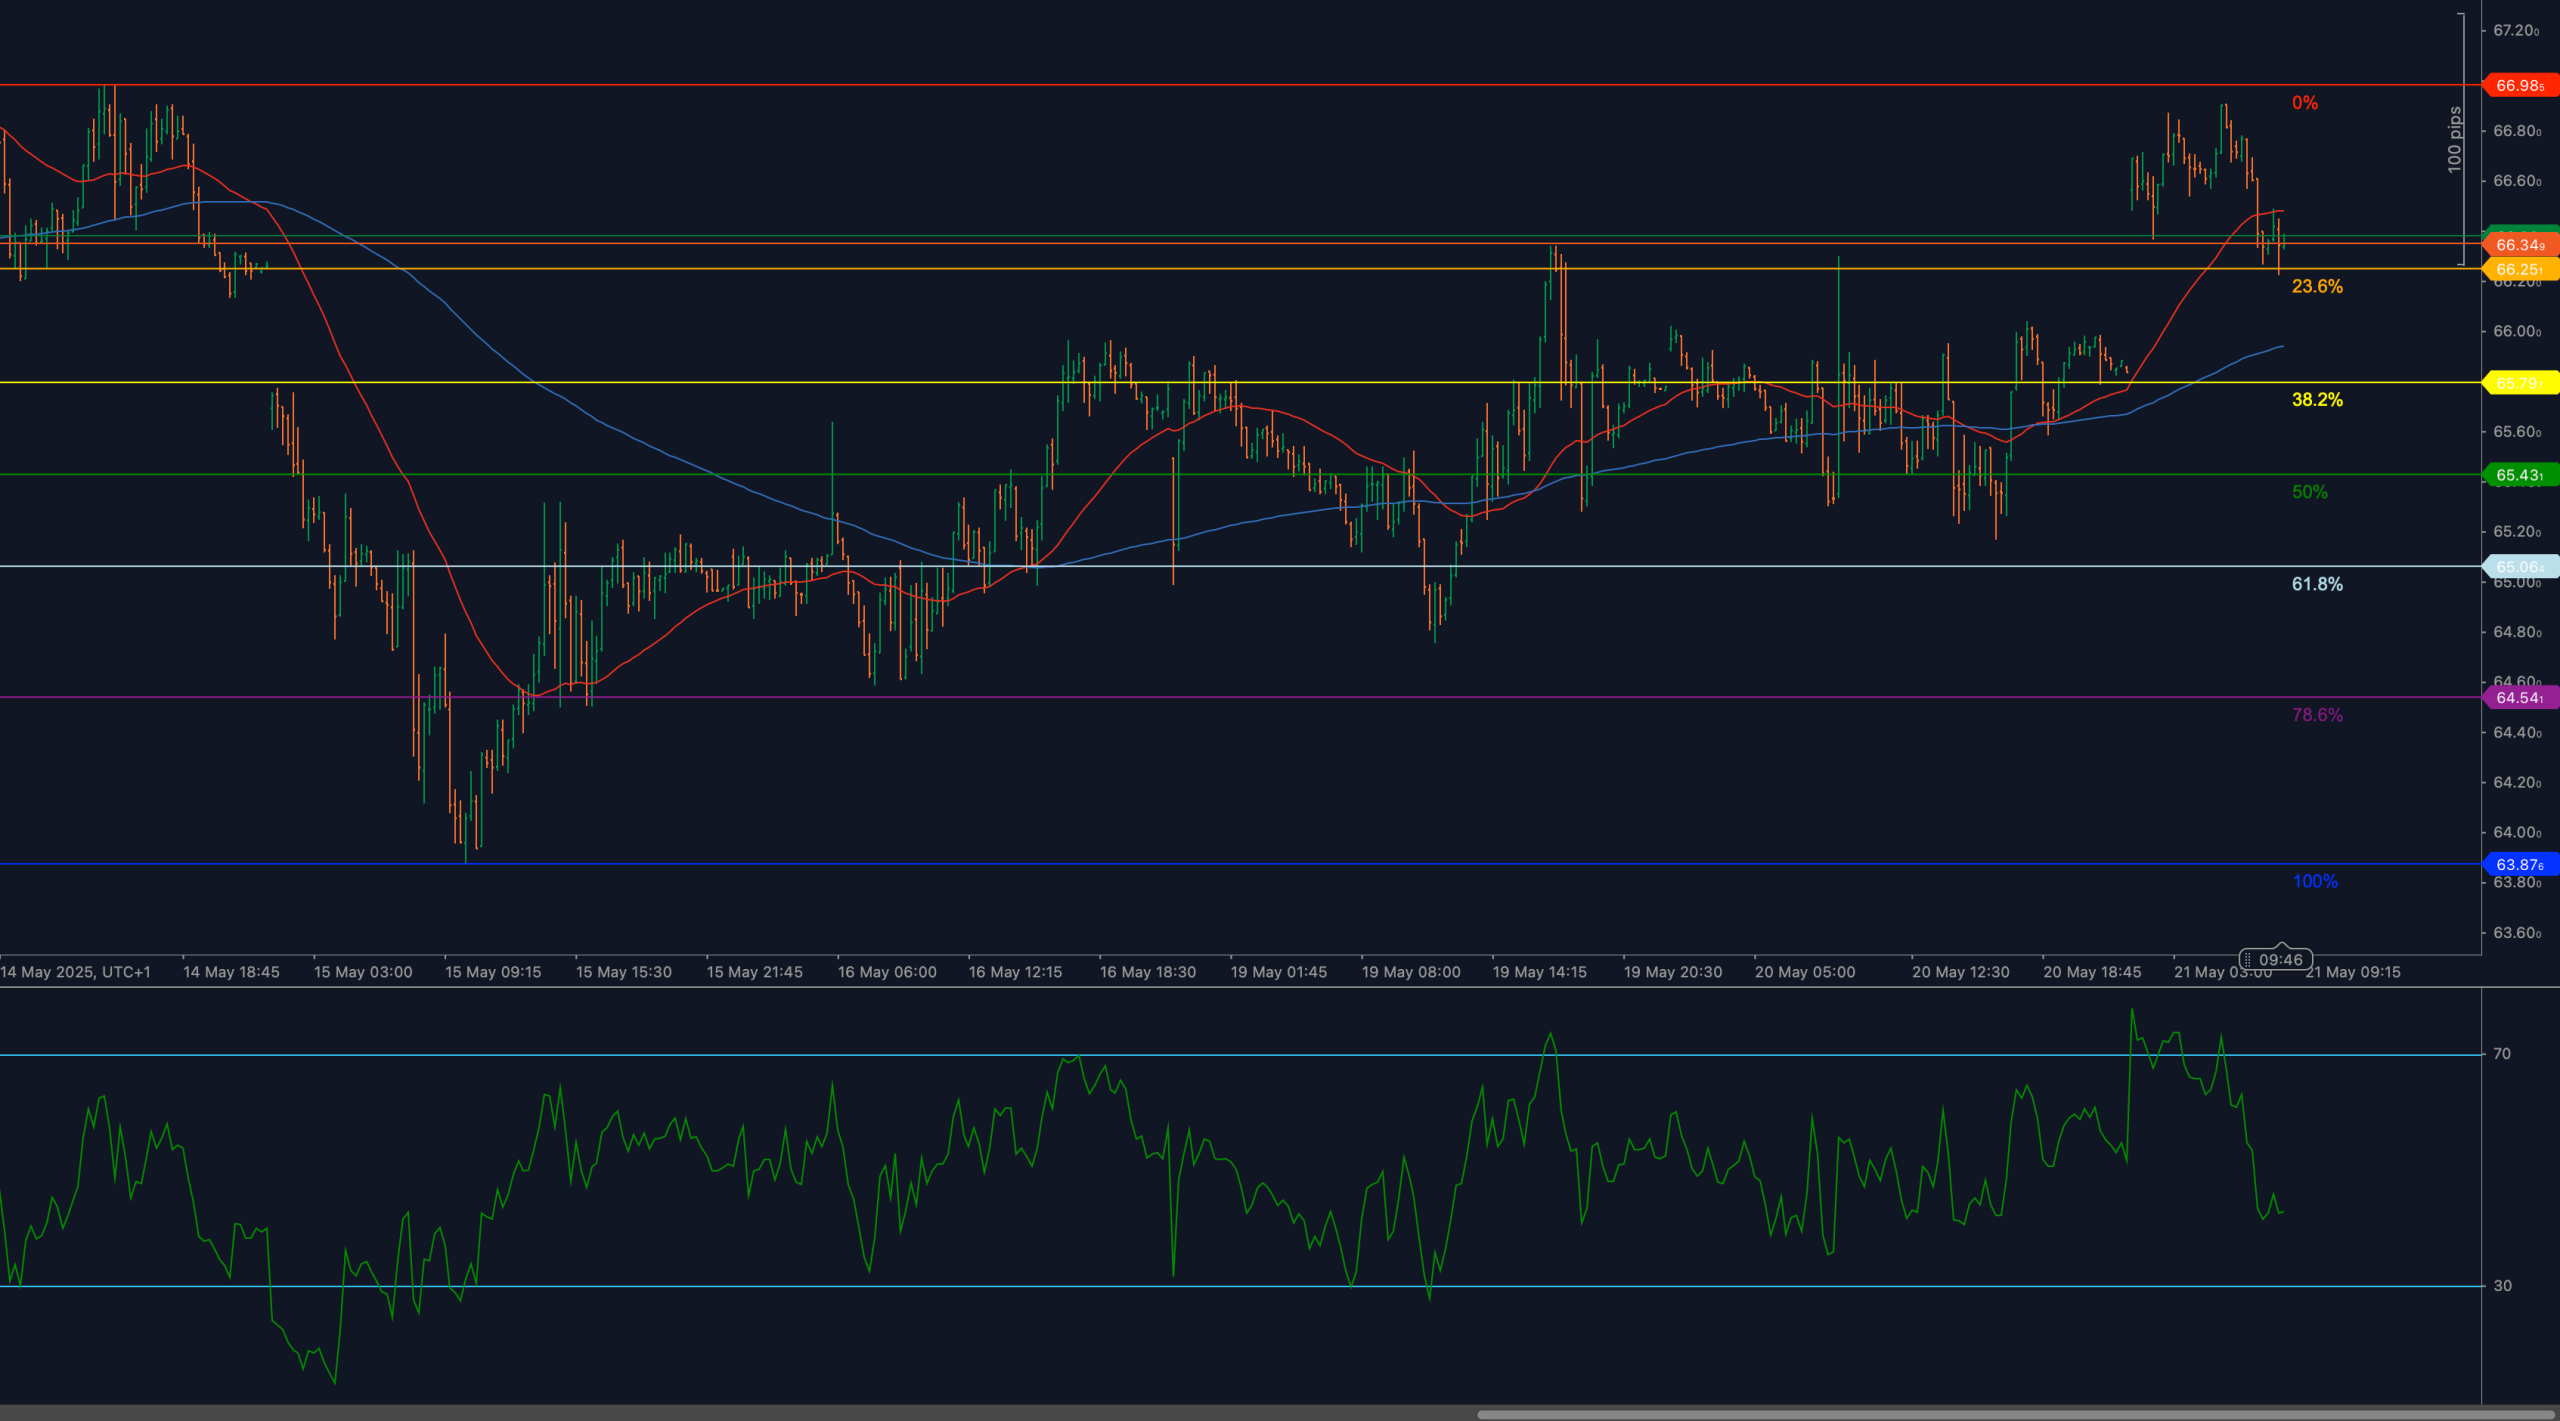
UKOIL failed to hold gains above 66.98, reversing sharply after an intraday breakout attempt. Price has since slipped below 66.34, a key resistance-turned-support level, and is now hovering near the 23.6% Fibonacci retracement at 66.21. The broader uptrend remains technically intact, but short-term momentum has clearly shifted, as RSI rolls overand intraday strength fades.
The move lower comes amid a mixed demand backdrop in energy markets, with short-term oversupply concerns weighing on price action. Unless bulls can reclaim structure above 66.34, the path of least resistance shifts toward deeper retracement levels in the sessions ahead.
📈 TECHNICAL ANALYSIS
Key Support and Resistance Levels
The nearest resistance is now defined by the 66.34 level, which marked prior breakout structure. A sustained recovery above this zone would be required to re-open the high at 66.98, and further upside toward the 67.20 extension zone.
Support rests initially at 66.21, the 23.6% retracement of the May 16–21 rally. A confirmed break below this level would expose 65.19, aligning with the 38.2% retracement, and further down at 65.04, the midpoint of the swing and structurally critical zone for near-term trend preservation.
Moving Averages and Dynamic Price Action
Price action has rolled back beneath the 50-period weighted moving average, now near 66.30, while the 200-WMAcontinues to offer deeper trend support near 65.20. The break back below the 50-WMA signals a short-term momentum loss, and unless quickly reclaimed, the bearish tone may continue.
If bulls can recover and hold back above the 50-WMA, upside structure would stabilize. Otherwise, further pressure toward the 200-WMA becomes likely.
RSI Momentum and Bearish Pressure
The 14-period RSI spiked above 70 during the recent breakout attempt but has since reversed sharply, now tracking below 50. This loss of momentum confirms a shift in sentiment and warns of additional downside unless RSI finds support near the 45–40 region.
A sustained drop below 40 would confirm bearish reacceleration and shift attention to the 38.2% and 50% retracement zones. Bulls must reclaim RSI >55 to neutralize current weakness.
Candlestick Behavior and Price Action Clarity
Candlestick structure reflects a failed breakout, with upper shadows forming near 66.98 and a sequence of lower closes. This shift confirms fading participation at higher levels and places emphasis on whether bulls can defend the 66.21–66.00 zone.
No bullish reversal signal has emerged yet, and unless a decisive bullish engulfing or bottoming formation appears, bearish pressure may persist in the short term.
Chart Structure and Breakdown Formation
The overall structure is beginning to tilt corrective after a sharp advance from 63.87 to 66.98. The inability to hold above 66.34 — and the fast rejection from highs — marks a transition from breakout extension to active pullback.
The developing sequence now resembles a retracement wave, and unless 66.34 is recovered quickly, the risk of a rounded top or descending pattern forming increases. Bears may remain active while price trades below this key pivot.
Fibonacci Retracement and Extension Levels
The Fibonacci retracement drawn from 63.87 (May 16 low) to 66.98 (May 21 high) outlines the current pullback structure. Price has already tested the 23.6% retracement at 66.21, and a close below this level would activate the next downside area at 65.19, the 38.2% retracement.
A deeper retracement would target 65.04, the 50% level and technical midpoint of the rally. Further below, the 61.8% retracement at 64.35 offers a final bullish defense. If all these levels fail, full retracement to 63.87 would invalidate the prior move.
To the upside, price must first reclaim 66.34, then retest the recent high at 66.98. A successful breakout would reopen the path toward 67.20–67.50, depending on extension strength.
🔍 MARKET OUTLOOK & TRADING SCENARIOS
Bullish Scenario
A swift recovery back above 66.34, confirmed with RSI rebounding above 55, would restore short-term bullish momentum. A retest of 66.98 would follow, with breakout targets at 67.20–67.50.
Neutral Scenario
Sideways consolidation between 66.21 and 66.34, with RSI drifting between 45–55, would suggest indecision. Bulls and bears may battle for short-term control near the 23.6% zone.
Bearish Scenario
A break and close below 66.21, especially with RSI dropping below 45, would signal renewed downside. This opens room toward 65.19, 65.04, and possibly 64.35, if momentum builds.
💼 TRADING CONSIDERATIONS
Short setups may be considered below 66.21 on RSI weakness and bearish continuation candles. Pullback buys into 65.19–65.04 may be valid if momentum stabilizes. A confirmed breakout above 66.98 would re-engage long-side interest.
🏁 CONCLUSION
UKOIL has reversed from 66.98 and now trades below 66.34, with RSI losing momentum and price pressing into key support. Unless buyers quickly reclaim structure, the move appears corrective, with downside zones at 65.19 and 65.04coming into play. A hold above 66.21 remains essential to stabilize structure.
⚠️ DISCLAIMER
This analysis is for informational purposes only and does not constitute financial advice. Always consult with a licensed financial professional before making trading decisions.


