
MARKET OVERVIEW
Brent crude oil (UKOIL) has entered a critical phase as prices test the significant resistance level at 73.20. After experiencing a substantial decline in mid-February that pushed prices below the 200-day moving average, the market has shown signs of recovery with a series of higher lows forming over the past week. This current price action comes amid mixed fundamental factors including ongoing geopolitical tensions in the Middle East, concerns about global economic growth, and recent inventory data that has provided some support to crude oil prices.
TECHNICAL ANALYSIS
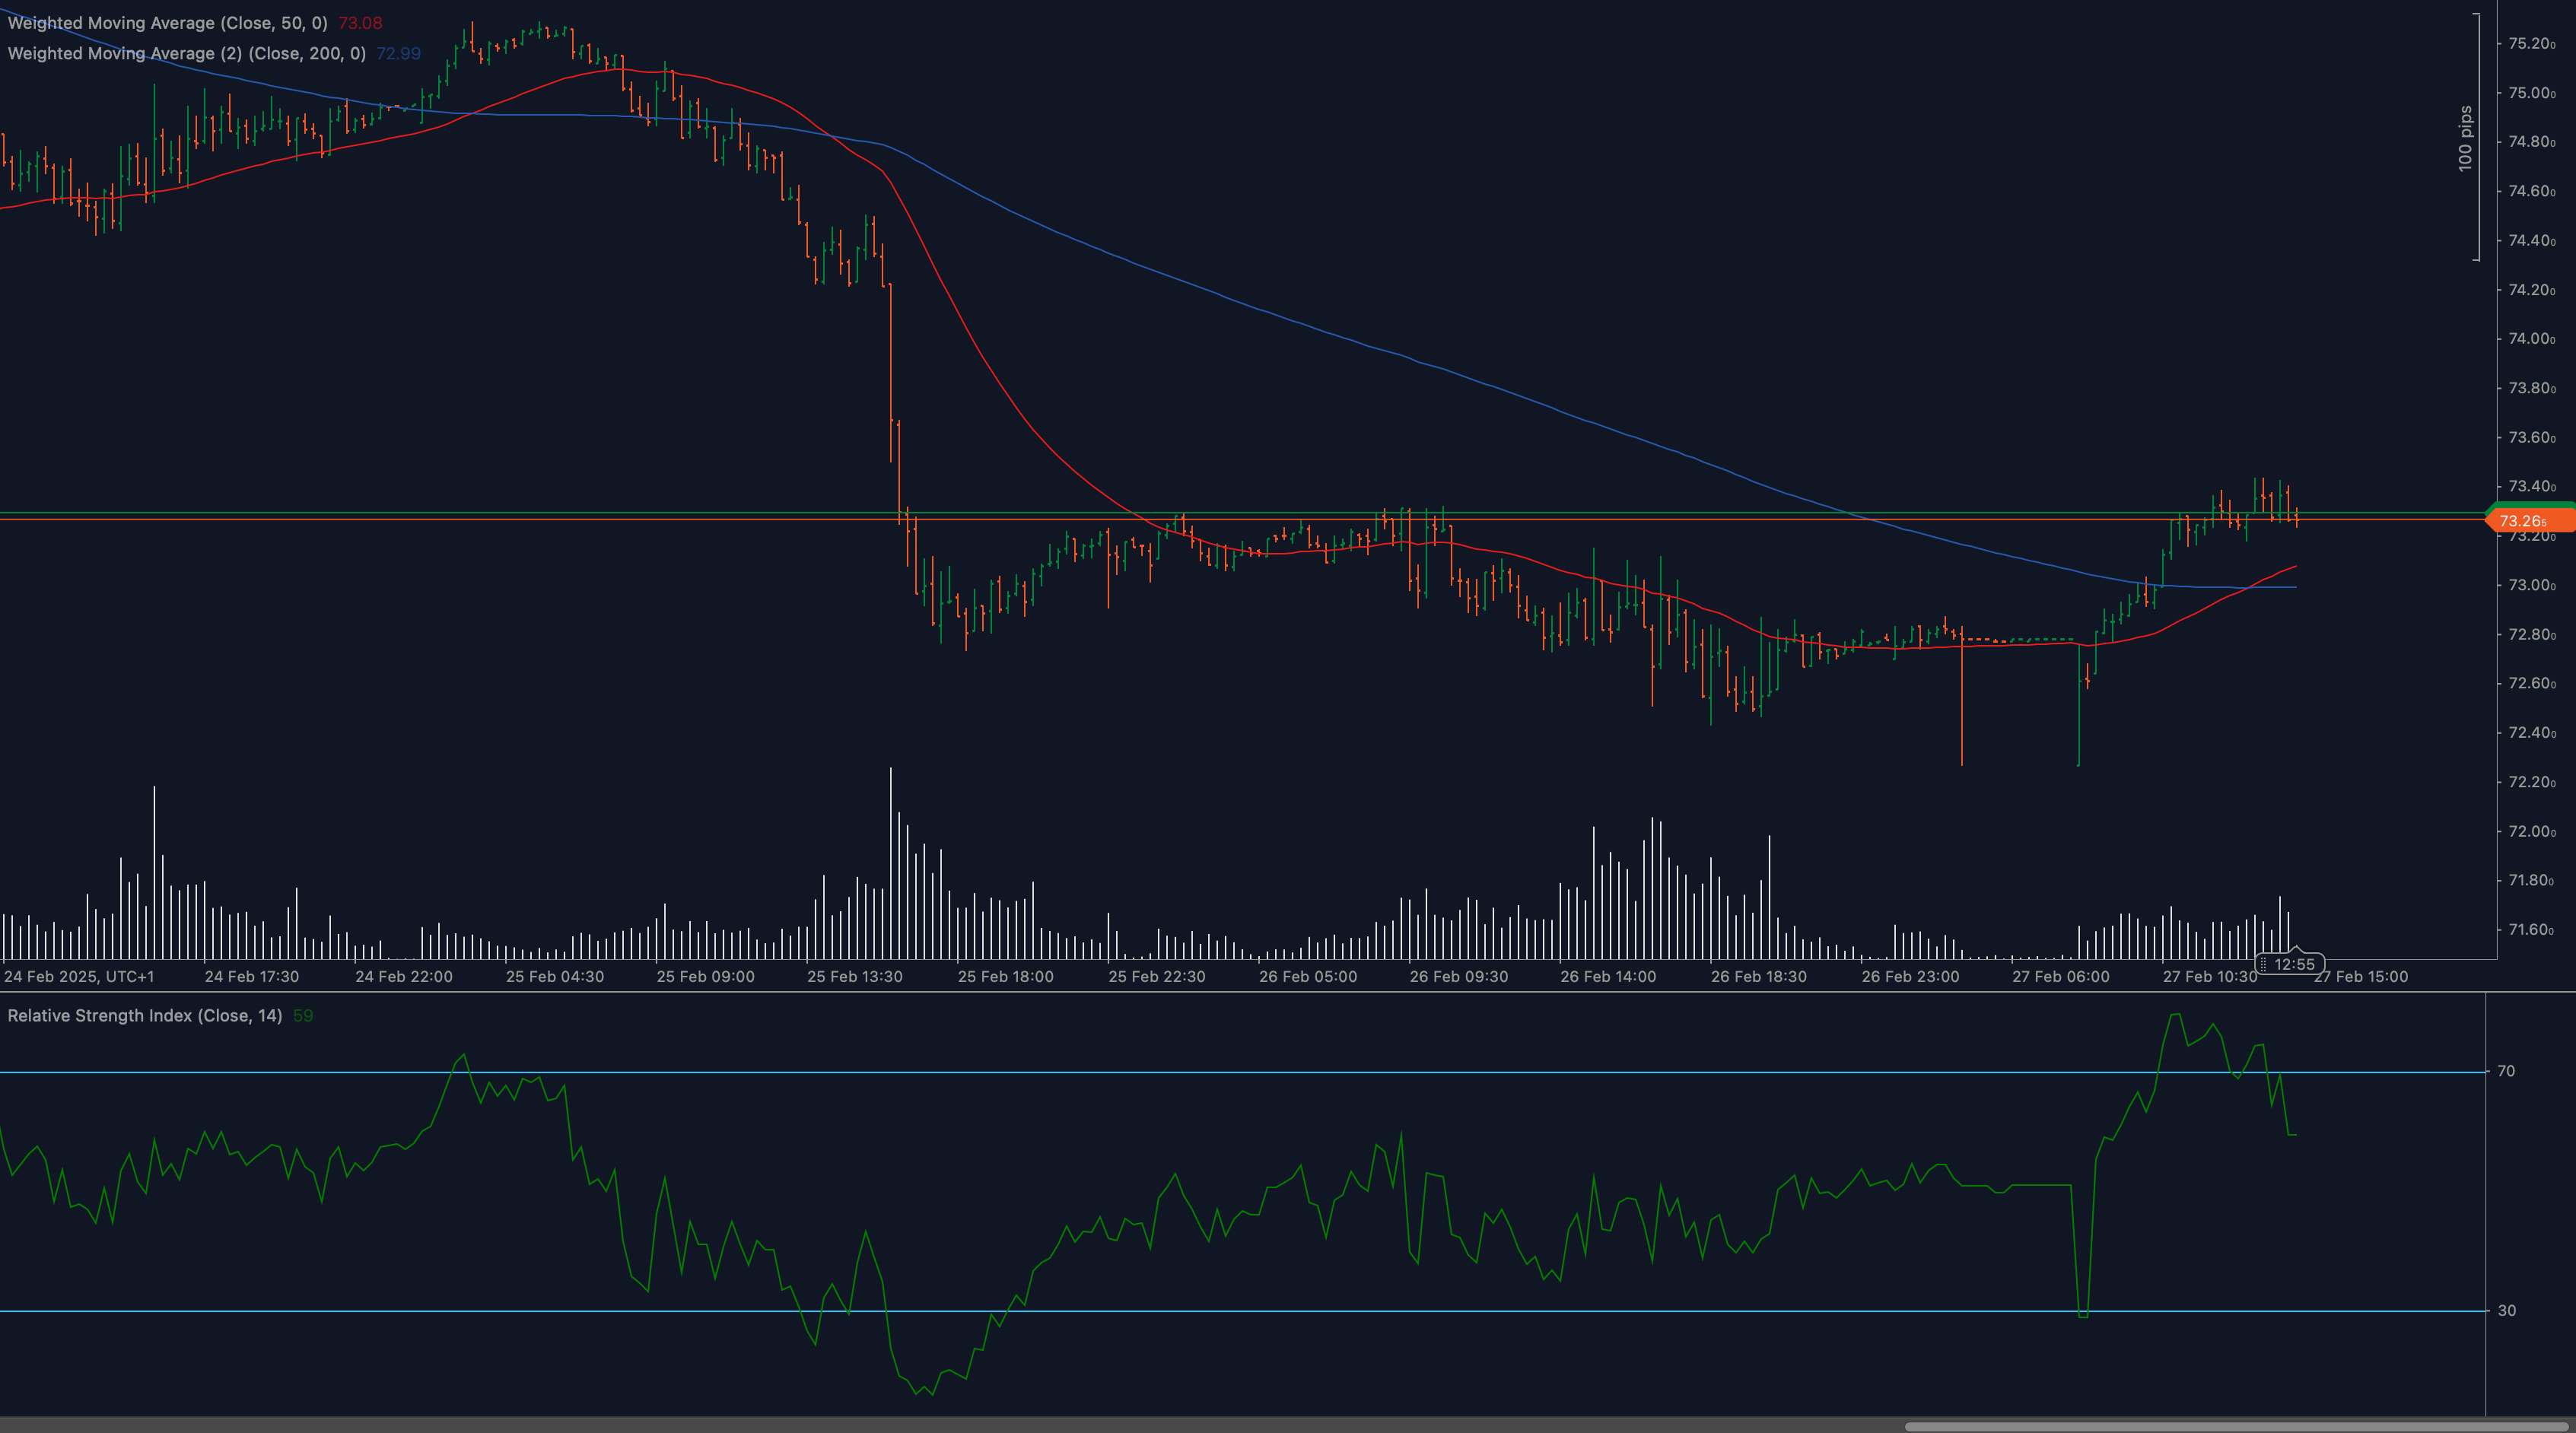
The technical picture for UKOIL shows a market at an important inflection point. The price is currently testing the 73.20 resistance level, which previously acted as support before the sharp decline. This level has now converted to resistance and represents a significant technical barrier for bulls to overcome. The 50-day moving average (73.09, displayed in red) is positioned below the 200-day moving average (74.23, displayed in blue), confirming the bearish trend that has been in place. However, the 50-day MA is beginning to flatten and potentially curl upward, which could signal a shift in the longer-term trend if sustained.
Price action has improved significantly over the past week, with UKOIL forming a series of higher lows and higher highs, indicating strengthening bullish momentum. The most recent candlesticks show increased buying pressure as prices push against the 73.20 resistance level. Volume has also picked up during the recent recovery, supporting the validity of the upward move.
The Relative Strength Index (RSI) at 64 shows strengthening momentum, having recovered from oversold conditions following the mid-February decline. The RSI has established a positive trajectory, which supports the potential for further upside if the current resistance can be broken. The indicator’s push above the 60 level is particularly significant as it suggests growing bullish conviction in the market.
Support levels have been established at 72.40 (recent swing low), 72.00 (psychological level), and 71.60 (previous consolidation area). On the upside, beyond the immediate 73.20 resistance, further barriers exist at 74.00 (psychological level) and the 200-day moving average at 74.23.
MARKET OUTLOOK & TRADING SCENARIOS
Bullish Scenario: A decisive break and daily close above the 73.20 resistance would open the path toward the 74.00 psychological level, followed by a test of the 200-day moving average at 74.23. Sustained momentum could then target the 75.00 level in the medium term. This scenario would be reinforced by continued strength in the RSI and increasing volume on upward moves.
Neutral Scenario: Price could continue to consolidate between 72.40 and 73.20 as the market seeks additional directional catalysts. In this scenario, traders should watch for the development of a range-trading pattern and consider position sizing accordingly. The 50-day moving average could provide dynamic support if it continues to curl upward.
Bearish Scenario: Failure to break above 73.20 followed by a retreat below 72.40 would suggest the recovery has lost momentum. This could lead to a retest of the recent lows near 71.60, with potential for further downside if global economic concerns intensify. The 70.00 psychological level would become a key target if bearish momentum accelerates.
TRADING CONSIDERATIONS
Traders should consider implementing a breakout strategy at the 73.20 resistance level, with confirmation through a daily close above this threshold before establishing long positions. Stop losses could be placed below the recent swing low at 72.40 to limit downside risk. For those with a more conservative approach, waiting for a successful retest of 73.20 as support after a breakout could provide a higher-probability entry point.
Risk management is particularly important given the current market volatility. Position sizing should be adjusted to account for the average true range, which has expanded in recent weeks. Traders should also be aware of upcoming inventory reports and OPEC announcements, which could dramatically impact price action.
For those favoring a mean-reversion approach, the recent convergence of price toward the 50-day moving average provides an interesting reference point for potential trades in either direction, depending on how price reacts to this dynamic level.
HISTORICAL CONTEXT
UKOIL has been in a broader downtrend since late 2023, with the recent price action representing a potential bottoming pattern. The sharp decline in mid-February represented a significant technical breakdown, breaching several support levels in quick succession. The current recovery effort comes after prices reached their lowest levels since December, creating a potential double-bottom formation if the current rally can gain further traction.
CONCLUSION
UKOIL stands at a critical technical juncture as it tests the important 73.20 resistance level. The improving RSI readings and recent price action suggest increasing bullish momentum that could lead to a meaningful recovery if the current resistance is breached. However, the presence of the bearish 50/200 MA configuration continues to signal caution. Traders should focus on the price action around the current resistance level, as a breakout or rejection will likely determine the market direction in the coming weeks. With global economic concerns balanced against geopolitical risk premiums, the technical picture becomes even more important for short to medium-term trading decisions.
DISCLAIMER
⚠️ Disclaimer: This analysis is for informational purposes only and should not be considered financial advice. Trading carries risk, and past performance does not guarantee future results. Conduct independent research before making investment decisions.


