
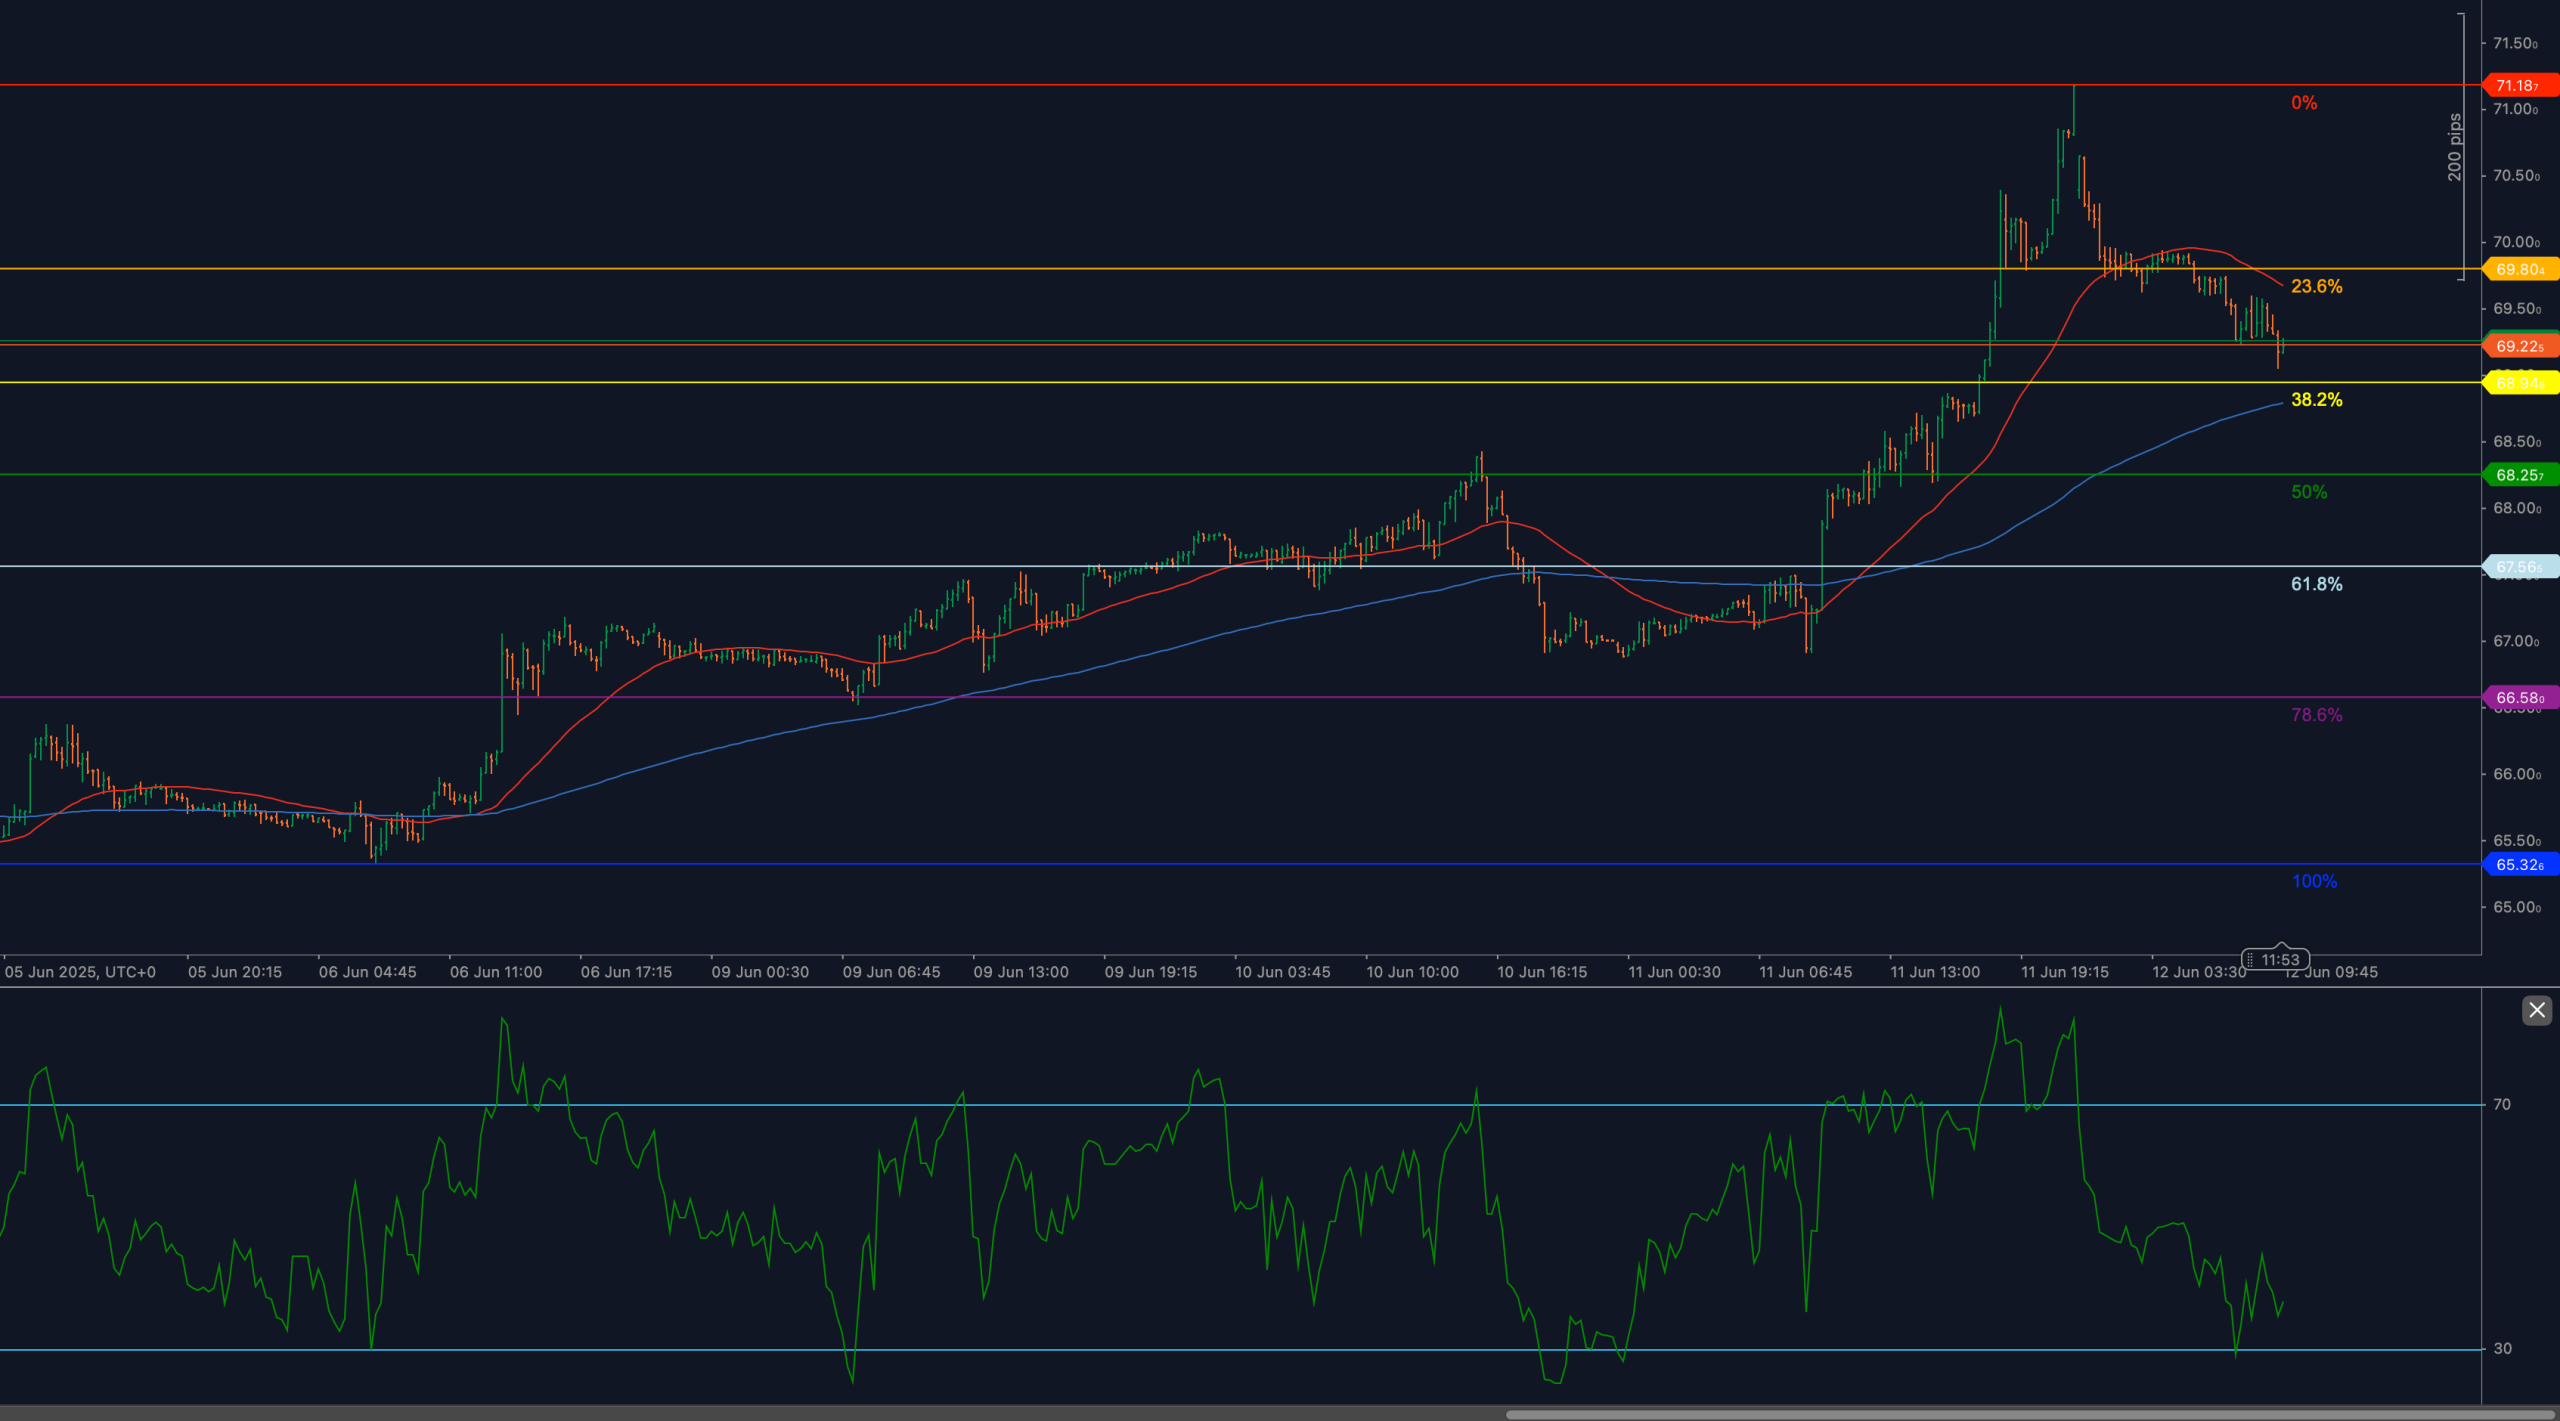
📊 MARKET OVERVIEW
UKOIL has shifted into corrective mode after topping out near 71.18 — the most recent swing high. The strong upside impulse that began in early June has started to unwind, with the price now pulling back toward key Fibonacci supports. The retreat has taken price through the 23.6% retracement at 69.80 and into a test of the 38.2% level at 69.22. RSI has turned lower from elevated levels, and the bullish momentum that previously drove the rally has clearly weakened.
The underlying macro context includes easing geopolitical risk premiums and moderate demand expectations. With crude oil futures pulling back and inventories weighing on sentiment, the recent spike is showing signs of exhaustion. Unless buyers reclaim key resistance zones, UKOIL is vulnerable to deeper retracement scenarios.
📈 TECHNICAL ANALYSIS
Key Support and Resistance Levels
The immediate support lies at 69.22, which aligns with the 38.2% Fibonacci retracement of the June rally. A clean break below this level would expose 68.25 — the 50% retracement — and further down, 67.55, the 61.8% level which marks a major structural support area. This confluence zone will be closely watched for signs of stabilization or bearish continuation.
On the upside, resistance is now clearly defined at 69.80, the 23.6% retracement, followed by the swing high at 71.18. A recovery through these levels would be needed to revalidate bullish continuation. However, unless price reclaims 69.80 with momentum, the path of least resistance remains to the downside.
Moving Averages and Dynamic Price Action
The 50-period and 200-period weighted moving averages are now beginning to flatten after several sessions of steady ascent. Price has dropped below the 50-WMA, and the 200-WMA near 68.80 is the next dynamic support to monitor. If price fails to hold above the longer-term average, it may indicate the start of a medium-term corrective phase rather than a temporary dip.
For a bullish scenario to reemerge, price would need to reclaim both WMAs and rotate higher with supportive RSI and volume confirmation. Until then, the flattening slope suggests trend exhaustion.
RSI Momentum and Bearish Pressure
The 14-period RSI has turned sharply lower from overbought territory and is now hovering near the 45 level. This confirms that buying momentum has diminished significantly, and the recent pullback is driven by more than short-term profit taking.
If RSI breaks below 40 and enters a lower band, further bearish momentum could accelerate. A divergence or bounce near key support zones would be needed to signal a pause in downside action. For now, the momentum profile favors further retracement unless price stabilizes above 69.22.
Candlestick Behavior and Price Action Clarity
Recent candles exhibit long upper wicks near 69.80 and smaller-bodied bearish closes, signaling strong rejection at former support turned resistance. The daily and intraday price action has shifted into a distribution pattern, where sellers are clearly overpowering attempts at recovery.
A decisive bullish engulfing bar or high-volume support candle near 69.22 would offer early evidence of renewed buyer interest. In the absence of such a signal, downside probing remains the higher probability outcome.
Chart Structure and Breakdown Formation
The rally structure that began on June 5 is now being challenged. After peaking at 71.18, price has lost momentum and slipped into a clean corrective sequence. The rounded top formation above 70.00 suggests exhaustion, and current price behavior reflects a retracement leg rather than a consolidation or bull flag.
If the structure fails to stabilize at 69.22 or 68.25, the entire leg from 65.32 lows to 71.18 highs may be at risk of being unwound. This would shift sentiment toward medium-term correction and reevaluation of the broader trend.
Fibonacci Retracement and Extension Levels
The Fibonacci retracement grid mapped from the 65.32 low to the 71.18 peak provides clear structure for the current pullback. The 23.6% retracement at 69.80 has already failed, and price is now probing the 38.2% level at 69.22 — often regarded as a critical test of trend continuity. If this zone gives way, 68.25 (50%) becomes the next logical target, followed by 67.55 (61.8%). These levels are important not only structurally but also psychologically for swing traders gauging trend durability. A close beneath 67.55 would mark a break in momentum and open the door to full retracement toward 65.32.
🔍 MARKET OUTLOOK & TRADING SCENARIOS
Bullish Scenario
If UKOIL holds above 69.22 and forms a base with RSI reclaiming 50+, a bounce back toward 69.80 could materialize. A break above that would re-engage upside toward 71.18. Volume and RSI confirmation would be critical to validate bullish continuation.
Neutral Scenario
Price consolidates between 69.22 and 68.25, with RSI oscillating between 40–50. This would reflect indecision and a potential reaccumulation zone ahead of the next directional move.
Bearish Scenario
A breakdown below 69.22 and especially 68.25 would confirm deeper retracement. RSI slipping below 40 would further support bearish continuation, with next targets at 67.55 and possibly full retracement to 65.32.
💼 TRADING CONSIDERATIONS
Short setups may be favored beneath 69.80, with breakdown confirmation below 69.22 offering initial entry points. Stops could be placed above 70.00, targeting 68.25 and 67.55. Bulls should remain sidelined until 69.80 is reclaimed and supported by stronger RSI recovery and price rotation above short-term resistance.
🏁 CONCLUSION
UKOIL has entered a meaningful retracement phase following its sharp rally to 71.18. Price is now testing the 38.2% Fibonacci level at 69.22, with RSI weakening and structure tilting bearish. Unless buyers step in to reclaim 69.80 and confirm support, the door remains open for deeper downside toward 68.25 or even 67.55 in the sessions ahead.
⚠️ DISCLAIMER
This analysis is for informational purposes only and does not constitute investment advice. Always consult with a licensed financial advisor before making any trading or investment decisions.


