
📊 MARKET OVERVIEW
UKOIL (Brent crude) remains under heavy pressure, declining steadily over the past week and now trading near a critical $63.30 level. The downtrend is well-established, with price consistently forming lower highs and lower lows, while momentum remains firmly with the bears.
Both short- and long-term trend indicators remain bearish. Volume has increased during selloffs, and the RSI remains pinned near oversold conditions. Traders must now determine whether this is a short-term base or a staging ground for deeper losses.
📈 TECHNICAL ANALYSIS
What Are the Key Support and Resistance Levels for UKOIL?
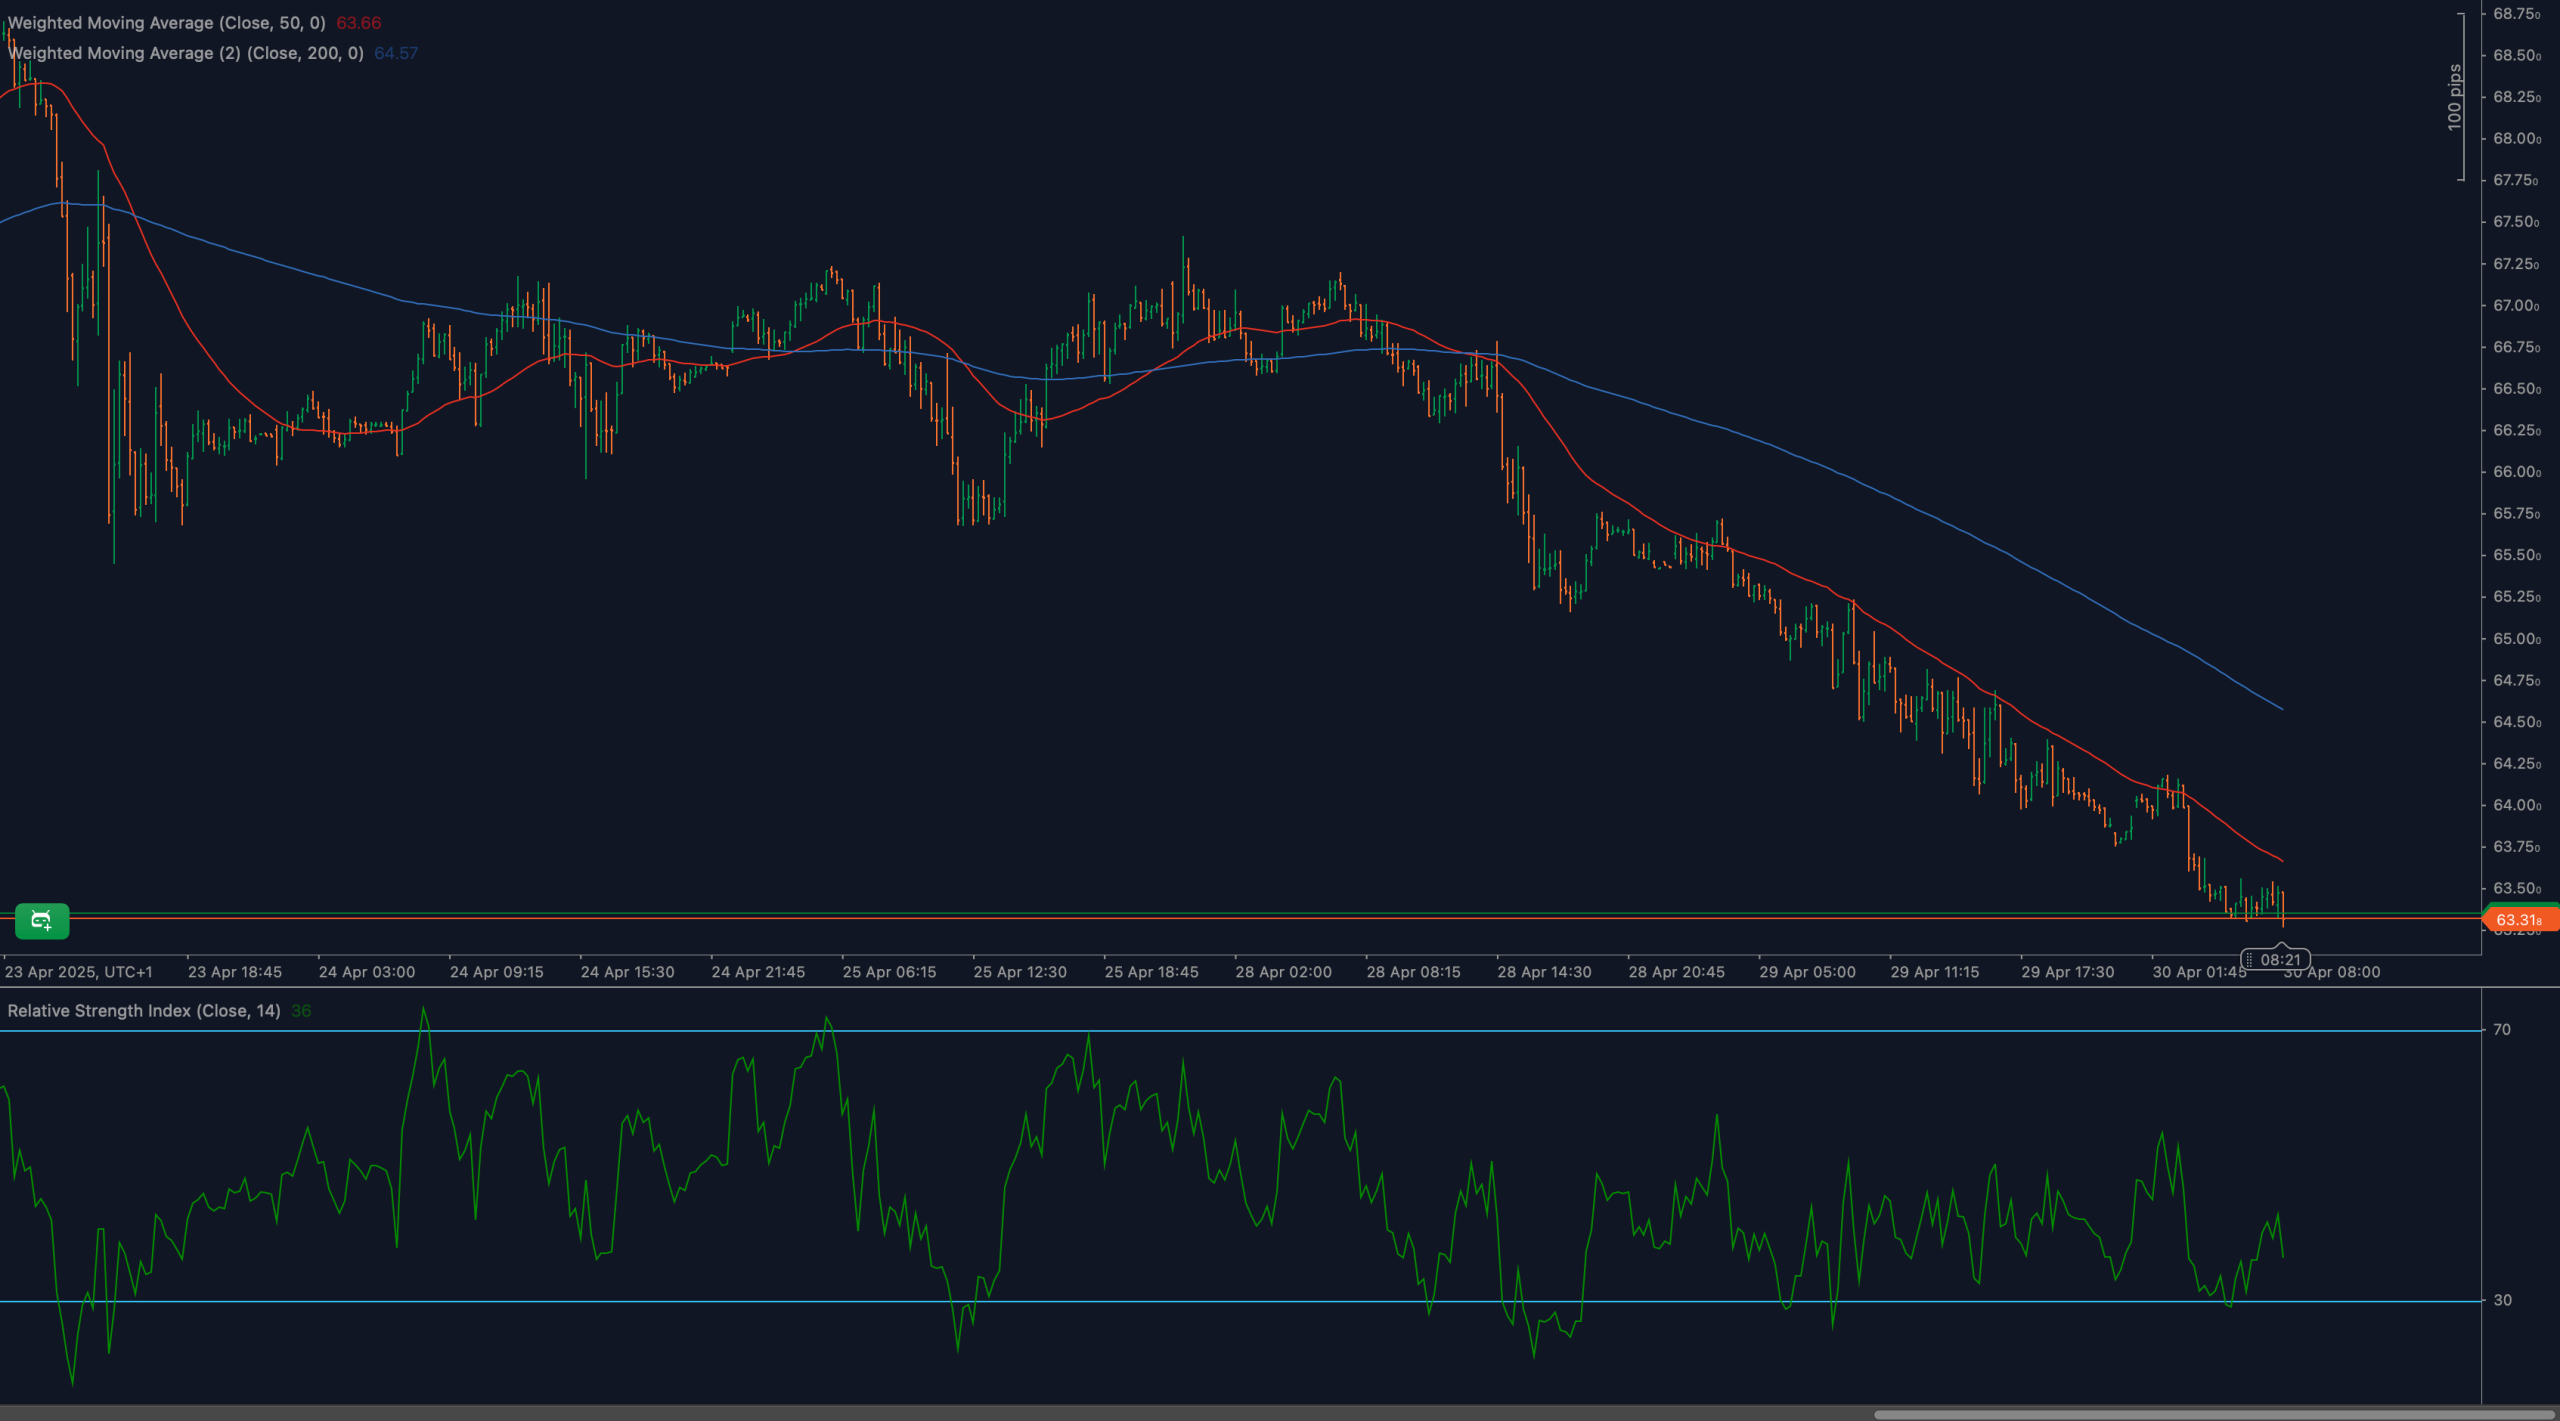
Key support is now found at $63.30, the current local low. A break below could send price toward $62.70 and $61.90— levels not seen since early April. Immediate resistance sits at $64.50, followed by stronger resistance at $65.80, near the falling 50-WMA.
Moving Average Analysis and Dynamic Price Levels
UKOIL remains well below both the 50-period WMA ($63.66) and the 200-period WMA ($64.57). Both averages are steeply sloped downward, reinforcing bearish trend strength. The 50-WMA has acted as dynamic resistance throughout the decline and will continue to cap any shallow bounces.
RSI Momentum Analysis and Divergence Patterns
The 14-period RSI is currently at 36, having bounced slightly from oversold territory. Although this indicates temporary relief, the RSI remains firmly in bearish territory. There is no bullish divergence on the chart — suggesting any recovery attempts could be limited unless conditions shift meaningfully.
Price Action and Candlestick Analysis
Candlesticks remain clearly biased to the downside, with consecutive bearish closes and little sign of reversal momentum. The latest candles near $63.30 show some hesitation with smaller bodies, but no clear bullish reversal pattern such as a hammer or engulfing candle is visible yet.
Chart Patterns and Formation Analysis
The dominant structure is a descending channel or grind lower pattern, with consistent pressure against support. Unless buyers manage to reclaim territory above $64.50, this structure favors breakdown continuation. A potential bear flag could also be forming if price attempts a weak bounce before continuation lower.
Fibonacci Retracement Levels and Extension Targets
Using the $66.40–$63.30 leg, the 38.2% retracement lies near $64.50, and the 61.8% level at $65.20 — both strong resistance zones if price attempts to recover. If $63.30 breaks, Fibonacci extensions suggest downside targets at $62.70(127.2%) and $61.90 (161.8%).
🔍 MARKET OUTLOOK & TRADING SCENARIOS
Bullish Scenario for UKOIL
A short-term bullish setup could emerge if price rebounds above $64.50 with momentum support and RSI pushing above 45. Targets in this case include $65.20 and potentially $66.00, though this would remain a countertrend move until moving averages are breached.
Neutral Scenario for UKOIL
If price consolidates between $63.30 and $64.50, a short-term base may be forming. RSI holding between 35–45 would support a sideways bias, but traders should avoid premature reversal calls without strong confirmation.
Bearish Scenario for UKOIL
A breakdown below $63.30 on volume, especially if RSI falls back toward 30, would confirm bearish continuation. This setup targets $62.70 and $61.90, with any bounces toward $64.00 likely to be faded.
💼 TRADING CONSIDERATIONS
Bearish trades remain favored below $64.50, targeting $62.70 and $61.90, with stops above $65.00. Trend-followers may continue to sell rallies until price convincingly breaks above the 50-WMA.
Bullish setups are high risk at this point and should only be considered on breakout confirmation above $64.50 with rising RSI and bullish candle structure. Until then, buying remains countertrend and vulnerable.
🏁 CONCLUSION
UKOIL is entrenched in a bearish trend, now testing the $63.30 level amid persistent selling. Momentum indicators and moving averages continue to favor further downside. While some short-term stabilization may emerge, the burden of proof remains on buyers. A clear breakout or breakdown from here will define the next phase.
⚠️ DISCLAIMER
This analysis is for informational purposes only and does not constitute investment advice. Always perform your own research and consult with a licensed advisor before making trading decisions.


