📊 Market Overview
The UKOIL has experienced volatility, oscillating between short-term rallies and pullbacks. The instrument is currently testing a key support level, with traders closely monitoring whether it can hold above this critical threshold or if further downside is imminent.
Following a series of upward movements, UKOIL encountered resistance, leading to a retracement towards the weighted moving averages and a test of established support levels.
📈 Technical Analysis
Key Support and Resistance Levels
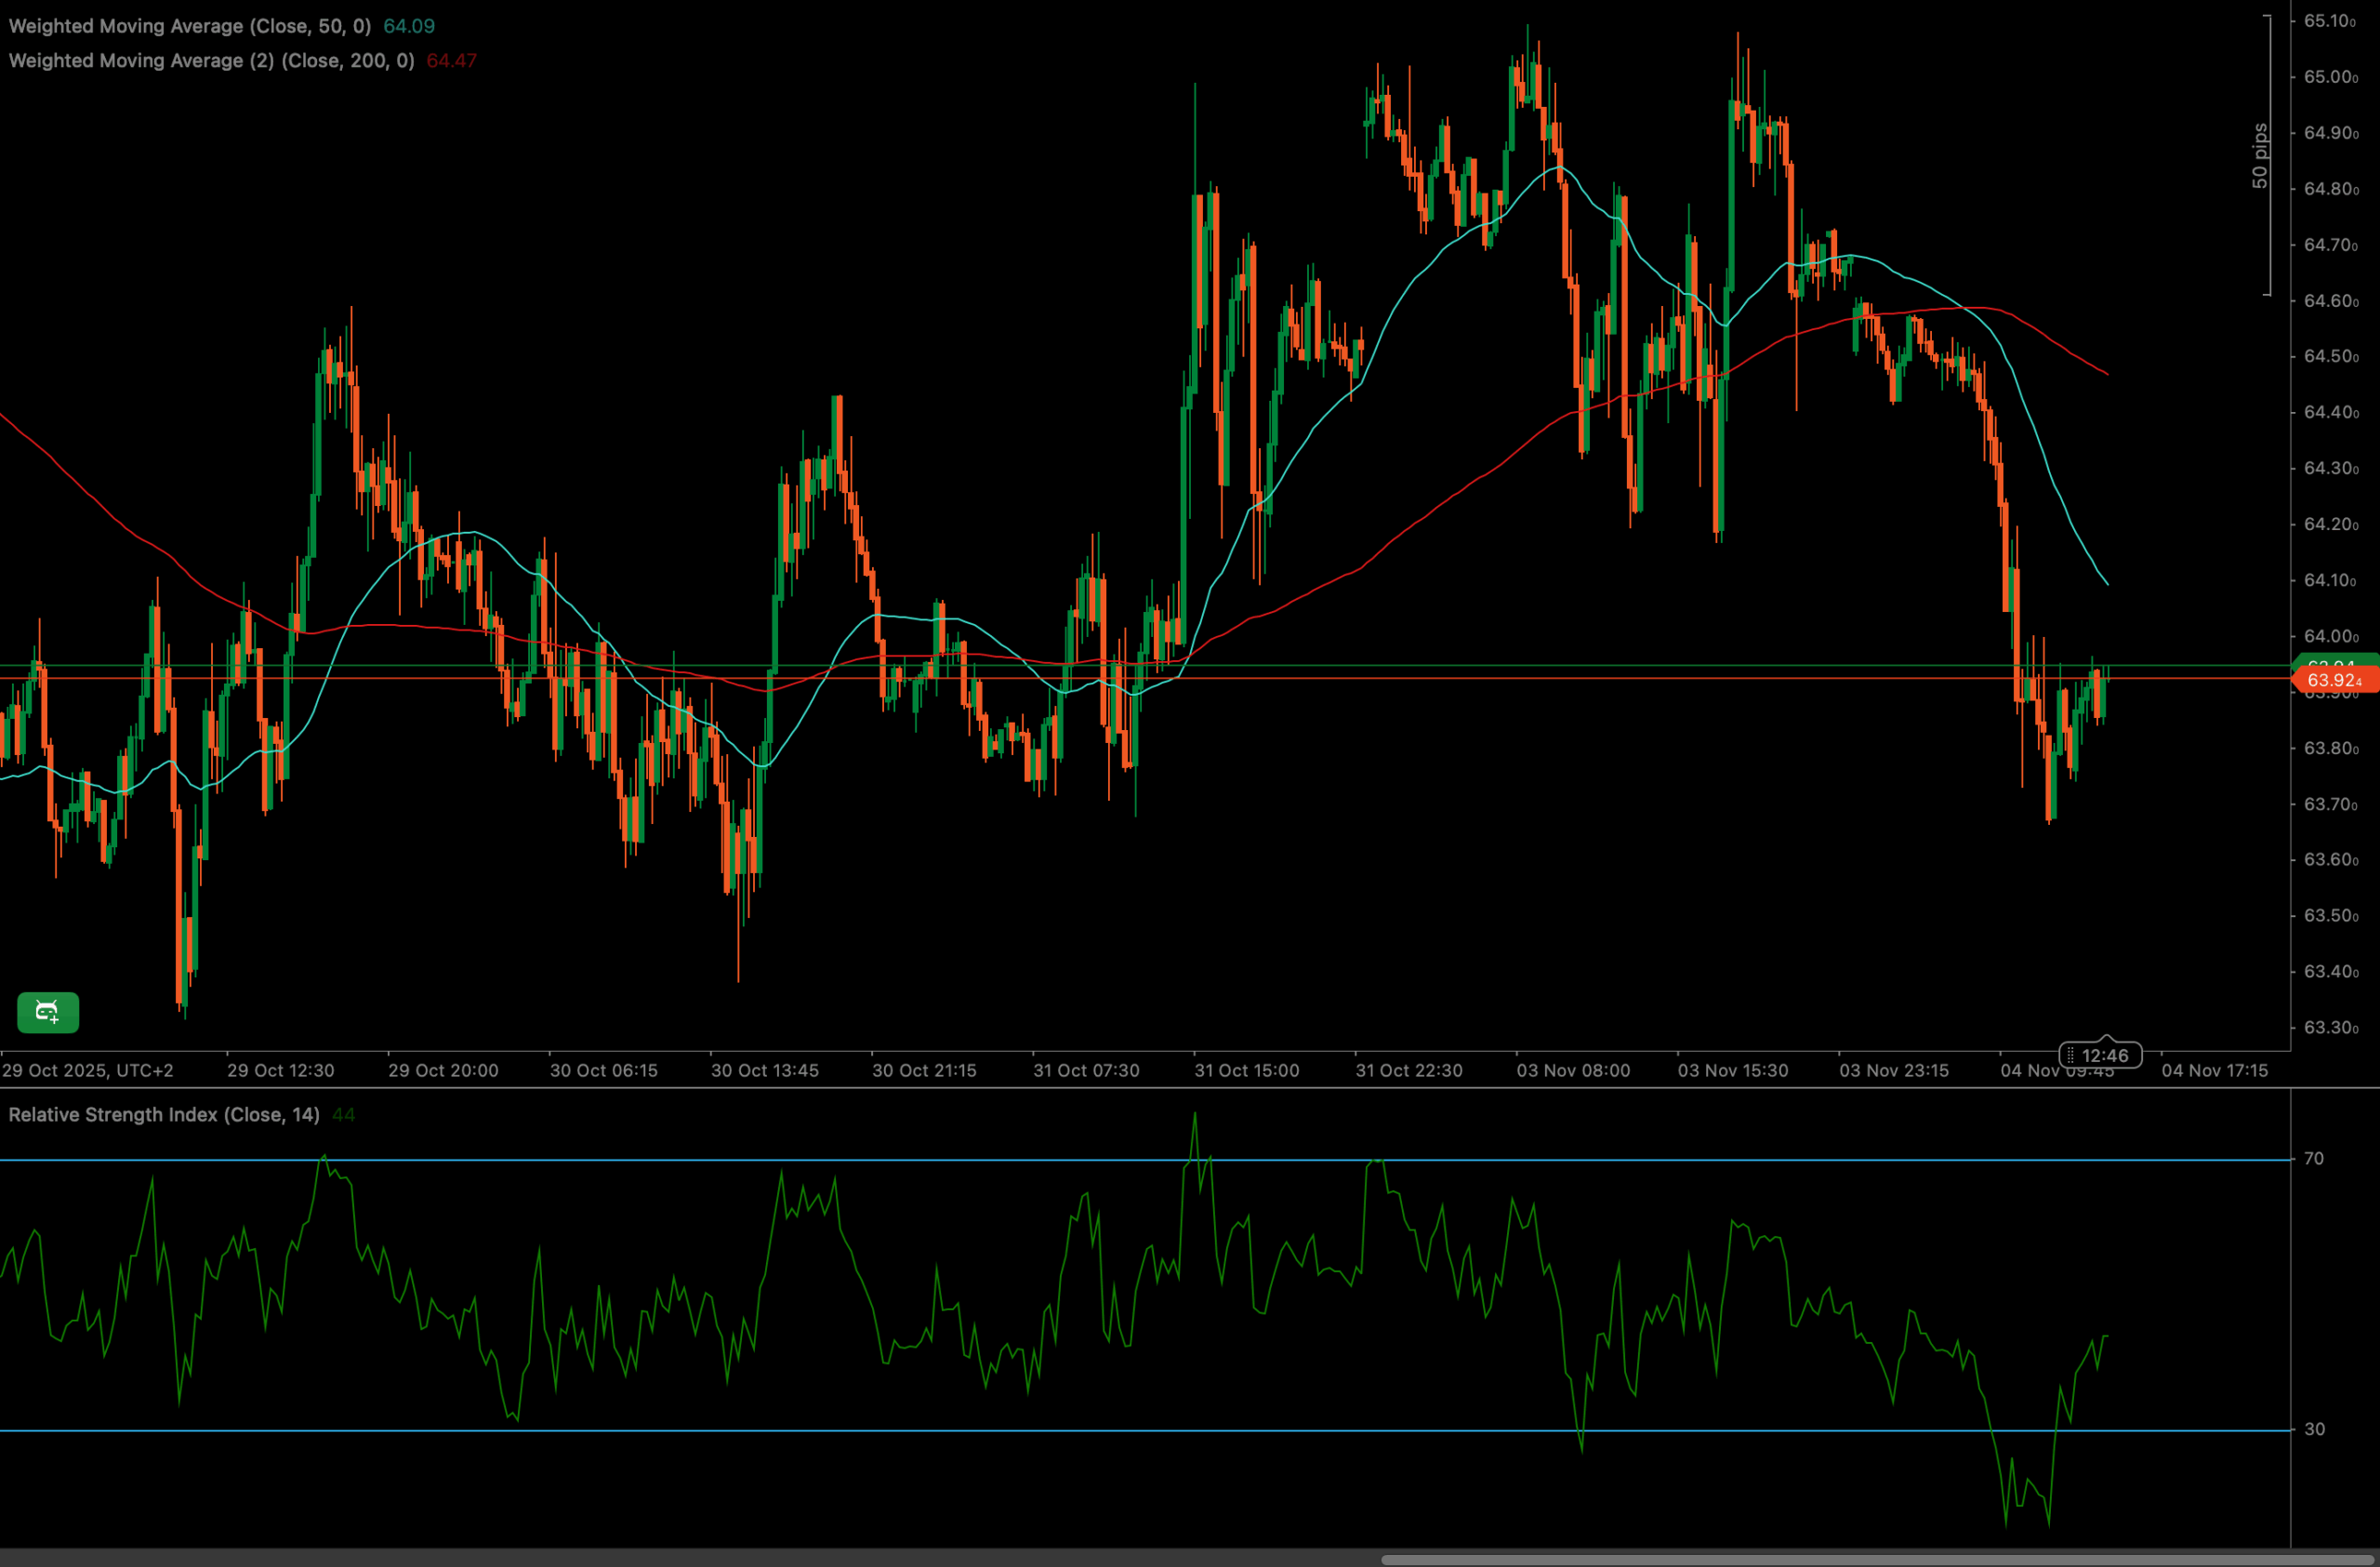
Immediate resistance for UKOIL appears to be around the 50-period Weighted Moving Average (WMA) at approximately 64.09, with further resistance at the recent highs. The instrument has found support at approximately 63.92. A break below this level could see the price decline further towards the 200-period WMA at 64.47. Note that the 200 WMA has already been breached, so traders should observe that recent performance.
Moving Average Analysis for UKOIL
Initially, the UKOIL price action remained mostly above the 50 WMA and flirted above and below the 200 WMA. As selling pressure increased, the price has now dropped below both moving averages. The 50 WMA (cyan line) is currently positioned below the 200 WMA (red line), signaling a potential shift towards a bearish trend. Traders should monitor these moving averages closely for potential crossovers or breakdowns.
RSI and Momentum Shift in UKOIL
The Relative Strength Index (RSI) shows the instrument currently near the oversold level of 30. This indicates the price has been under substantial selling pressure. If the RSI fails to bounce above 30, it could signal continued weakness. A prior peak above 70 suggests that the instrument was once overbought and due for a correction.
Volume Spike and Market Participation
Without explicit volume data on the chart, it is important to monitor volume on a trading platform to gauge the strength of the trends. Increased volume during a price decline would validate the bearish trend, while a rise in volume during a rebound might suggest a potential trend reversal for UKOIL.
Candlestick Tone and Market Reaction for UKOIL
The recent candlestick patterns on the chart suggest prevailing bearish sentiment following a peak. The appearance of smaller, indecisive candles around the current support level may indicate uncertainty or a battle between buyers and sellers. A decisive break below this level, or a strong bullish candle forming above it, will likely dictate the next move for UKOIL.
🔍 Market Outlook & Trading Scenarios
Bullish Scenario
If UKOIL can hold its support level and break above the 50 WMA, a potential rebound targeting the previous highs is possible. A successful move above this peak would indicate a return to the broader bullish trend.
Neutral Scenario
UKOIL may consolidate between the 63.92 support level and the 50 WMA resistance as the market assesses its next move. Sideways trading might continue until a clear catalyst emerges or a significant breakout transpires.
Bearish Scenario
A decisive break below the key support at 63.92, accompanied by increasing bearish momentum and an RSI drop below 30, could lead UKOIL towards lower support levels. Further declines below the 200 WMA could open the path to more significant losses.
💼 Trading Considerations
- Bullish setup: Seek confirmation of support, such as bullish candlestick formations or a move back above the 50 WMA. Initial target at the recent high.
- Breakout setup: A break above the 50 WMA could signal a move towards previous resistance levels. Conversely, a break below the key support level could signal a move lower.
- Bearish setup: A confirmed breakdown below the key support, with the RSI failing to rebound from 30, may offer short opportunities.
🏁 Conclusion
UKOIL is at a pivotal point, influenced by a recent bullish surge and a subsequent pullback. The instrument’s ability to maintain its support zone and react to the 50 WMA and 200 WMA will determine its short-term trajectory. The RSI signals caution, but also the potential for a rebound if oversold conditions prevail.
Traders should closely monitor these technical levels. A sustained move above the 50 WMA might suggest renewed bullish interest, while a break below current support may validate further downside momentum for UKOIL.
⚠️ Disclaimer
This analysis is for informational purposes only and does not constitute financial advice. Always consult a licensed financial advisor before making trading decisions.