
📊 Market Overview
The UKOIL has experienced a significant downtrend recently, breaking below key moving averages. The instrument is currently near its recent lows, with market participants closely watching for a potential bounce or further downside continuation.
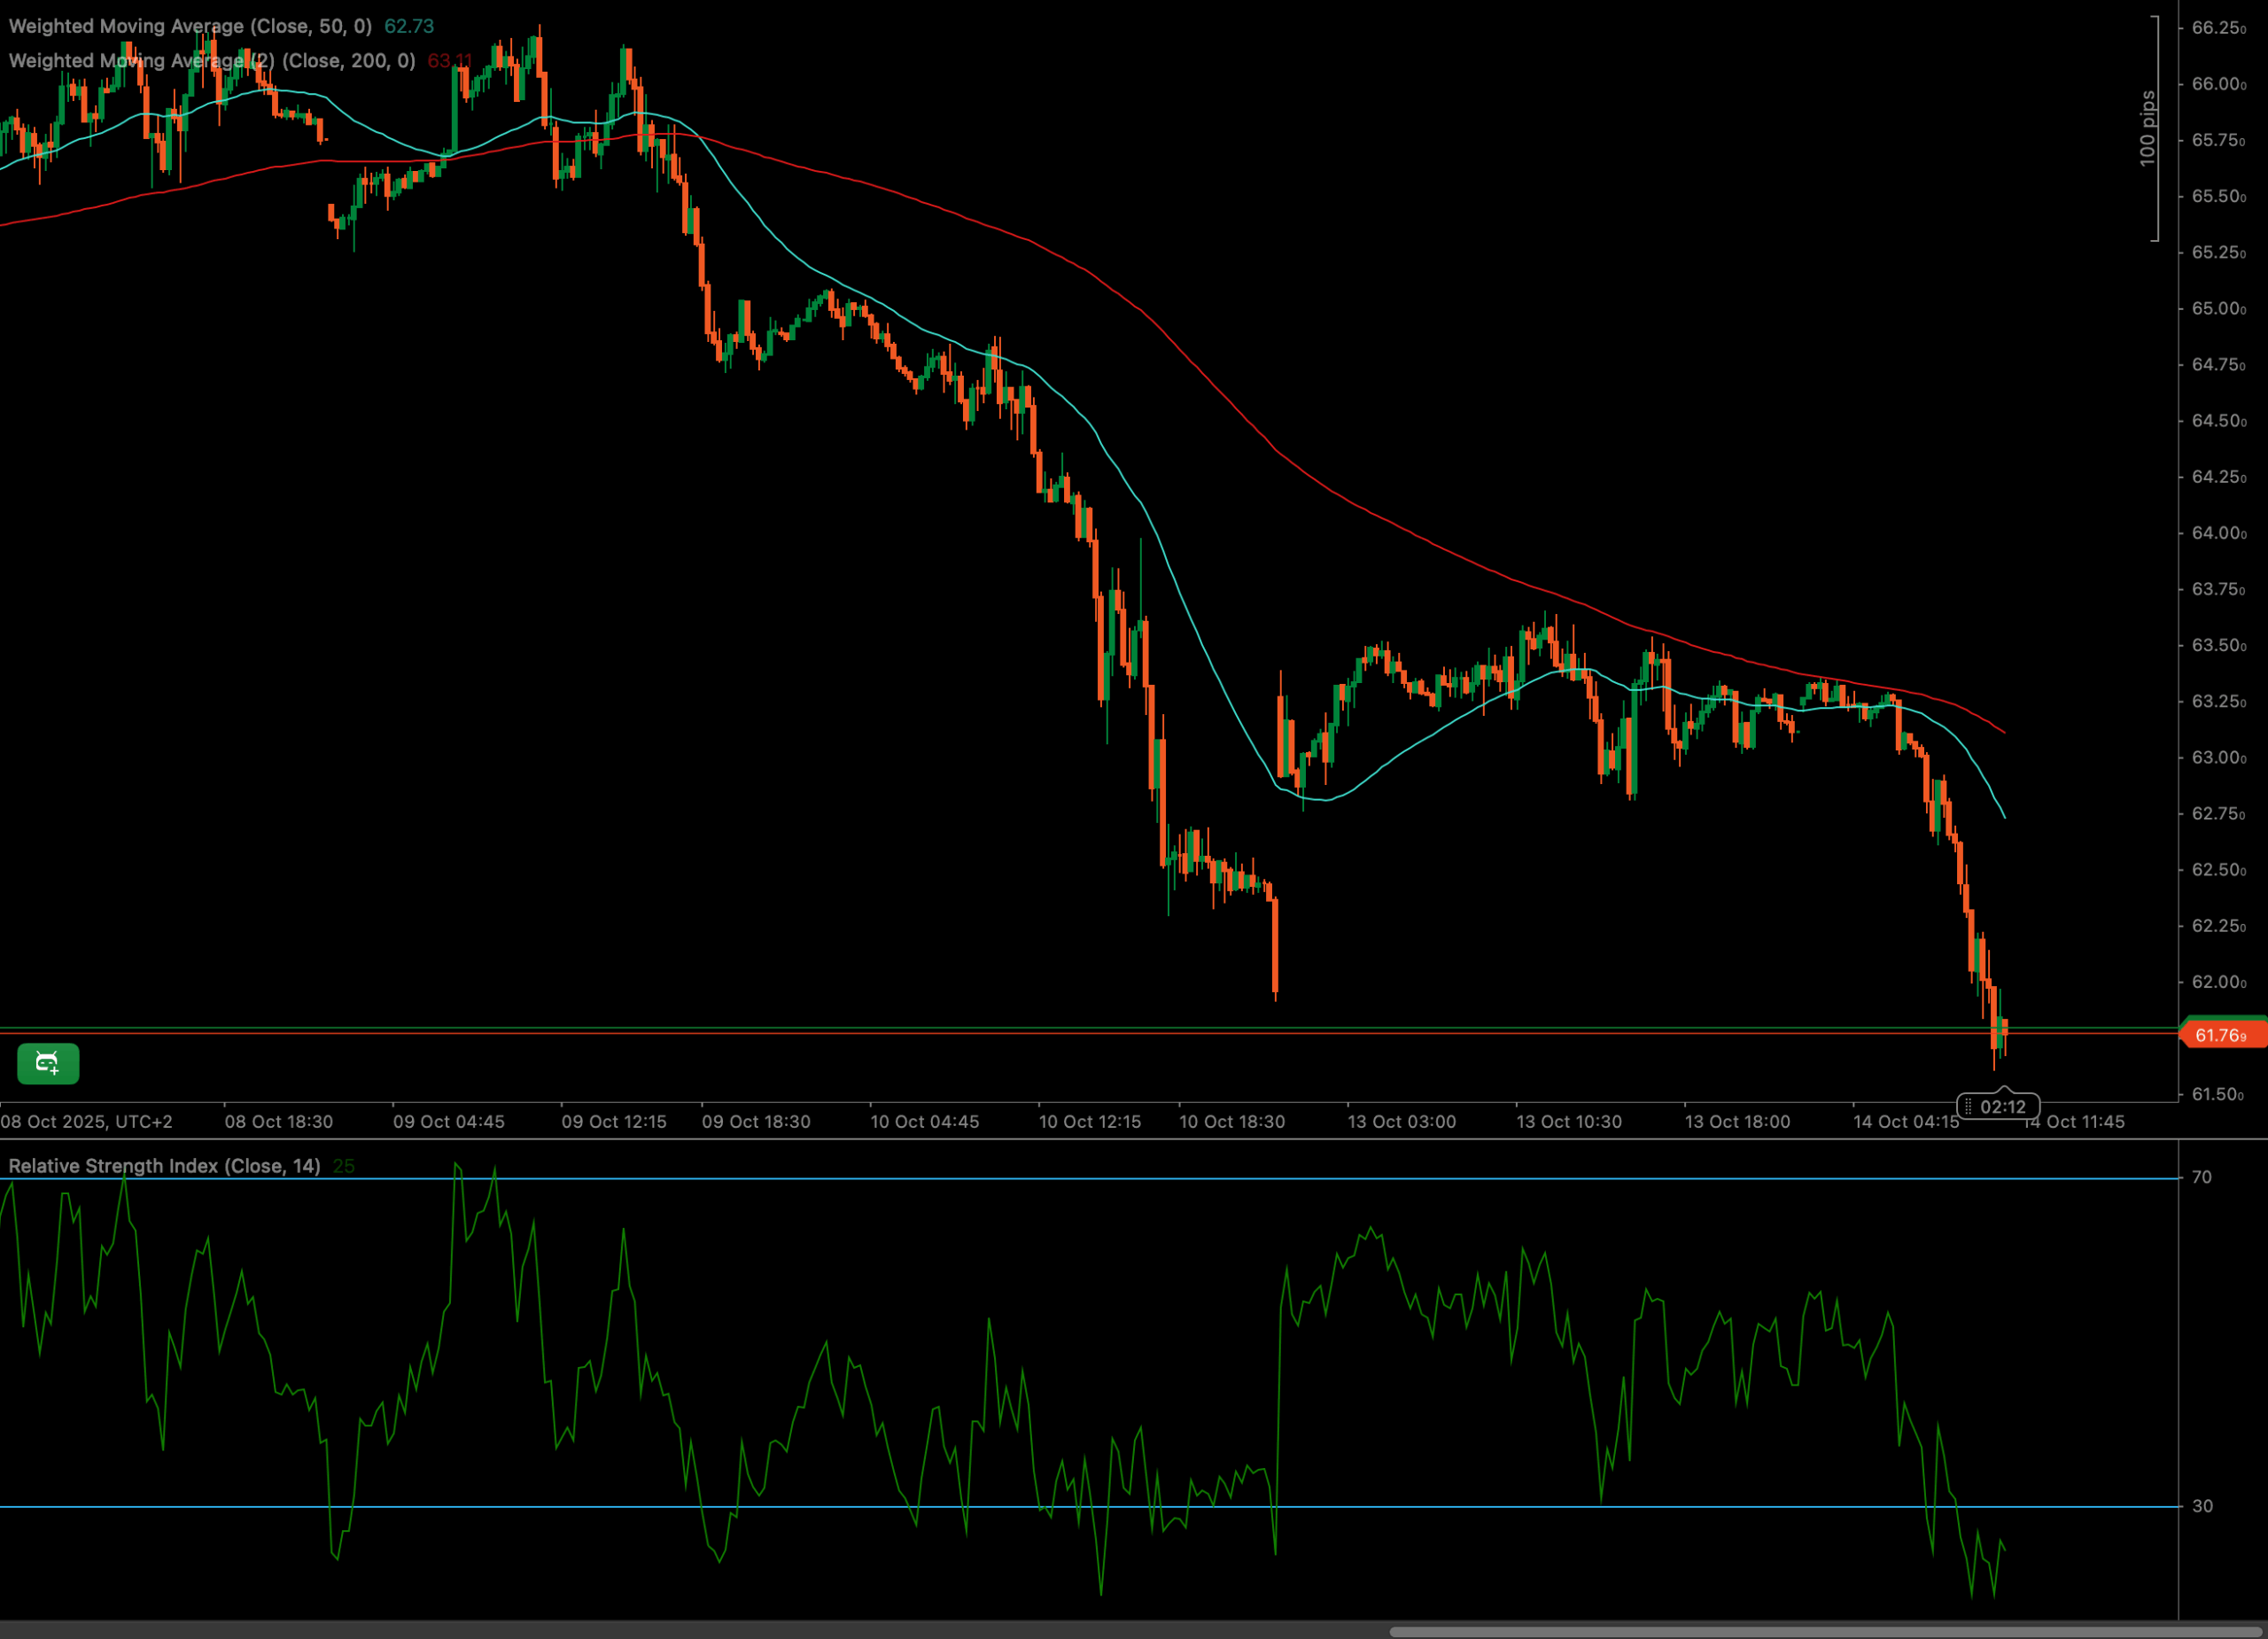
After fluctuating around both the 50-period Weighted Moving Average (WMA) and 200-period WMA, UKOIL faced strong selling pressure, breaking below these levels. This was followed by a period of strong bearish momentum, bringing the price to its recent low.
📈 Technical Analysis
Key Support and Resistance Levels
The immediate resistance for the UKOIL is observed near the 50-period Weighted Moving Average (WMA), followed by the 200-period WMA which is acting as dynamic resistance. On the downside, a crucial support level is near the recent low of 61.769. A break below this level could see the UKOIL continue its downtrend.
Moving Average Analysis for UKOIL
Initially, the UKOIL fluctuated around both the 50 WMA (cyan line) and the 200 WMA (red line). Now, the price has fallen below both the 50 WMA and 200 WMA, signaling a bearish shift in immediate momentum. The 50 WMA is below the 200 WMA, reinforcing the medium-term bearish trend. The 200 WMA now stands as a critical dynamic resistance level.
RSI and Momentum Shift in UKOIL
The Relative Strength Index (RSI) reflects the recent strong selling pressure on the UKOIL. The RSI is currently at 25, in the oversold territory of 30, suggesting that the asset might be nearing a point where buying interest could re-emerge, but also indicating further weakness if it stays in oversold conditions. Previously, the RSI was not in overbought territory, which indicates a relatively steady decline.
Volume Spike and Market Participation
While specific volume data is not visible on this chart, observing volume alongside price action is crucial for confirming trends. An increase in selling volume during the recent decline would confirm bearish pressure for the UKOIL. Traders should monitor volume on their platforms for additional confirmation.
Candlestick Tone and Market Reaction for UKOIL
The recent candlestick patterns for the UKOIL predominantly feature bearish candles, especially following a recent consolidation. This indicates strong selling pressure and profit-taking. Around the key support zone, bearish candles continue to form suggesting continued bearish pressure. A clear breakout or breakdown from this range, confirmed by subsequent candles, will be key.
🔍 Market Outlook & Trading Scenarios
Bullish Scenario
If the UKOIL can successfully bounce off its key support level and reclaim the 50 WMA, we could see a rebound targeting previous consolidation levels. A sustained move above the 200 WMA would indicate a potential trend reversal.
Neutral Scenario
The UKOIL might consolidate between the current support and the 50 WMA as the market digests recent moves. Sideways trading would likely persist until a clear catalyst emerges or a strong breakout of this range occurs.
Bearish Scenario
A decisive break below the key support, especially if accompanied by increasing bearish momentum and a continued oversold RSI, could lead the UKOIL to further downside. Further weakness below the 61.769 level could open the path to lower support levels.
💼 Trading Considerations
- Bullish setup: Look for confirmation of support, such as bullish candlestick patterns or a cross back above the 50 WMA. Target initial resistance at the 50 WMA.
- Breakout setup: A break above the 50 WMA could signal a move towards the 200 WMA. Conversely, a break below key support could signal a move towards lower levels.
- Bearish setup: A confirmed breakdown below key support, with the RSI failing to rebound from 30, could offer short opportunities targeting lower support levels.
🏁 Conclusion
The UKOIL is at a critical juncture, following a recent downtrend and approaching a key support level. The index’s ability to hold its support zone and react to the 50 WMA and 200 WMA will dictate its near-term direction. The oversold RSI suggests potential for a bounce, but also the risk of continued downside if bearish momentum continues.
Traders should monitor these key technical levels closely. A decisive move above the 50 WMA could signal renewed bullish interest, while a break below current support could confirm further downside momentum for the UKOIL.
⚠️ Disclaimer
This analysis is for informational purposes only and does not constitute financial advice. Always consult a licensed financial advisor before making trading decisions.


