
📊 Market Overview
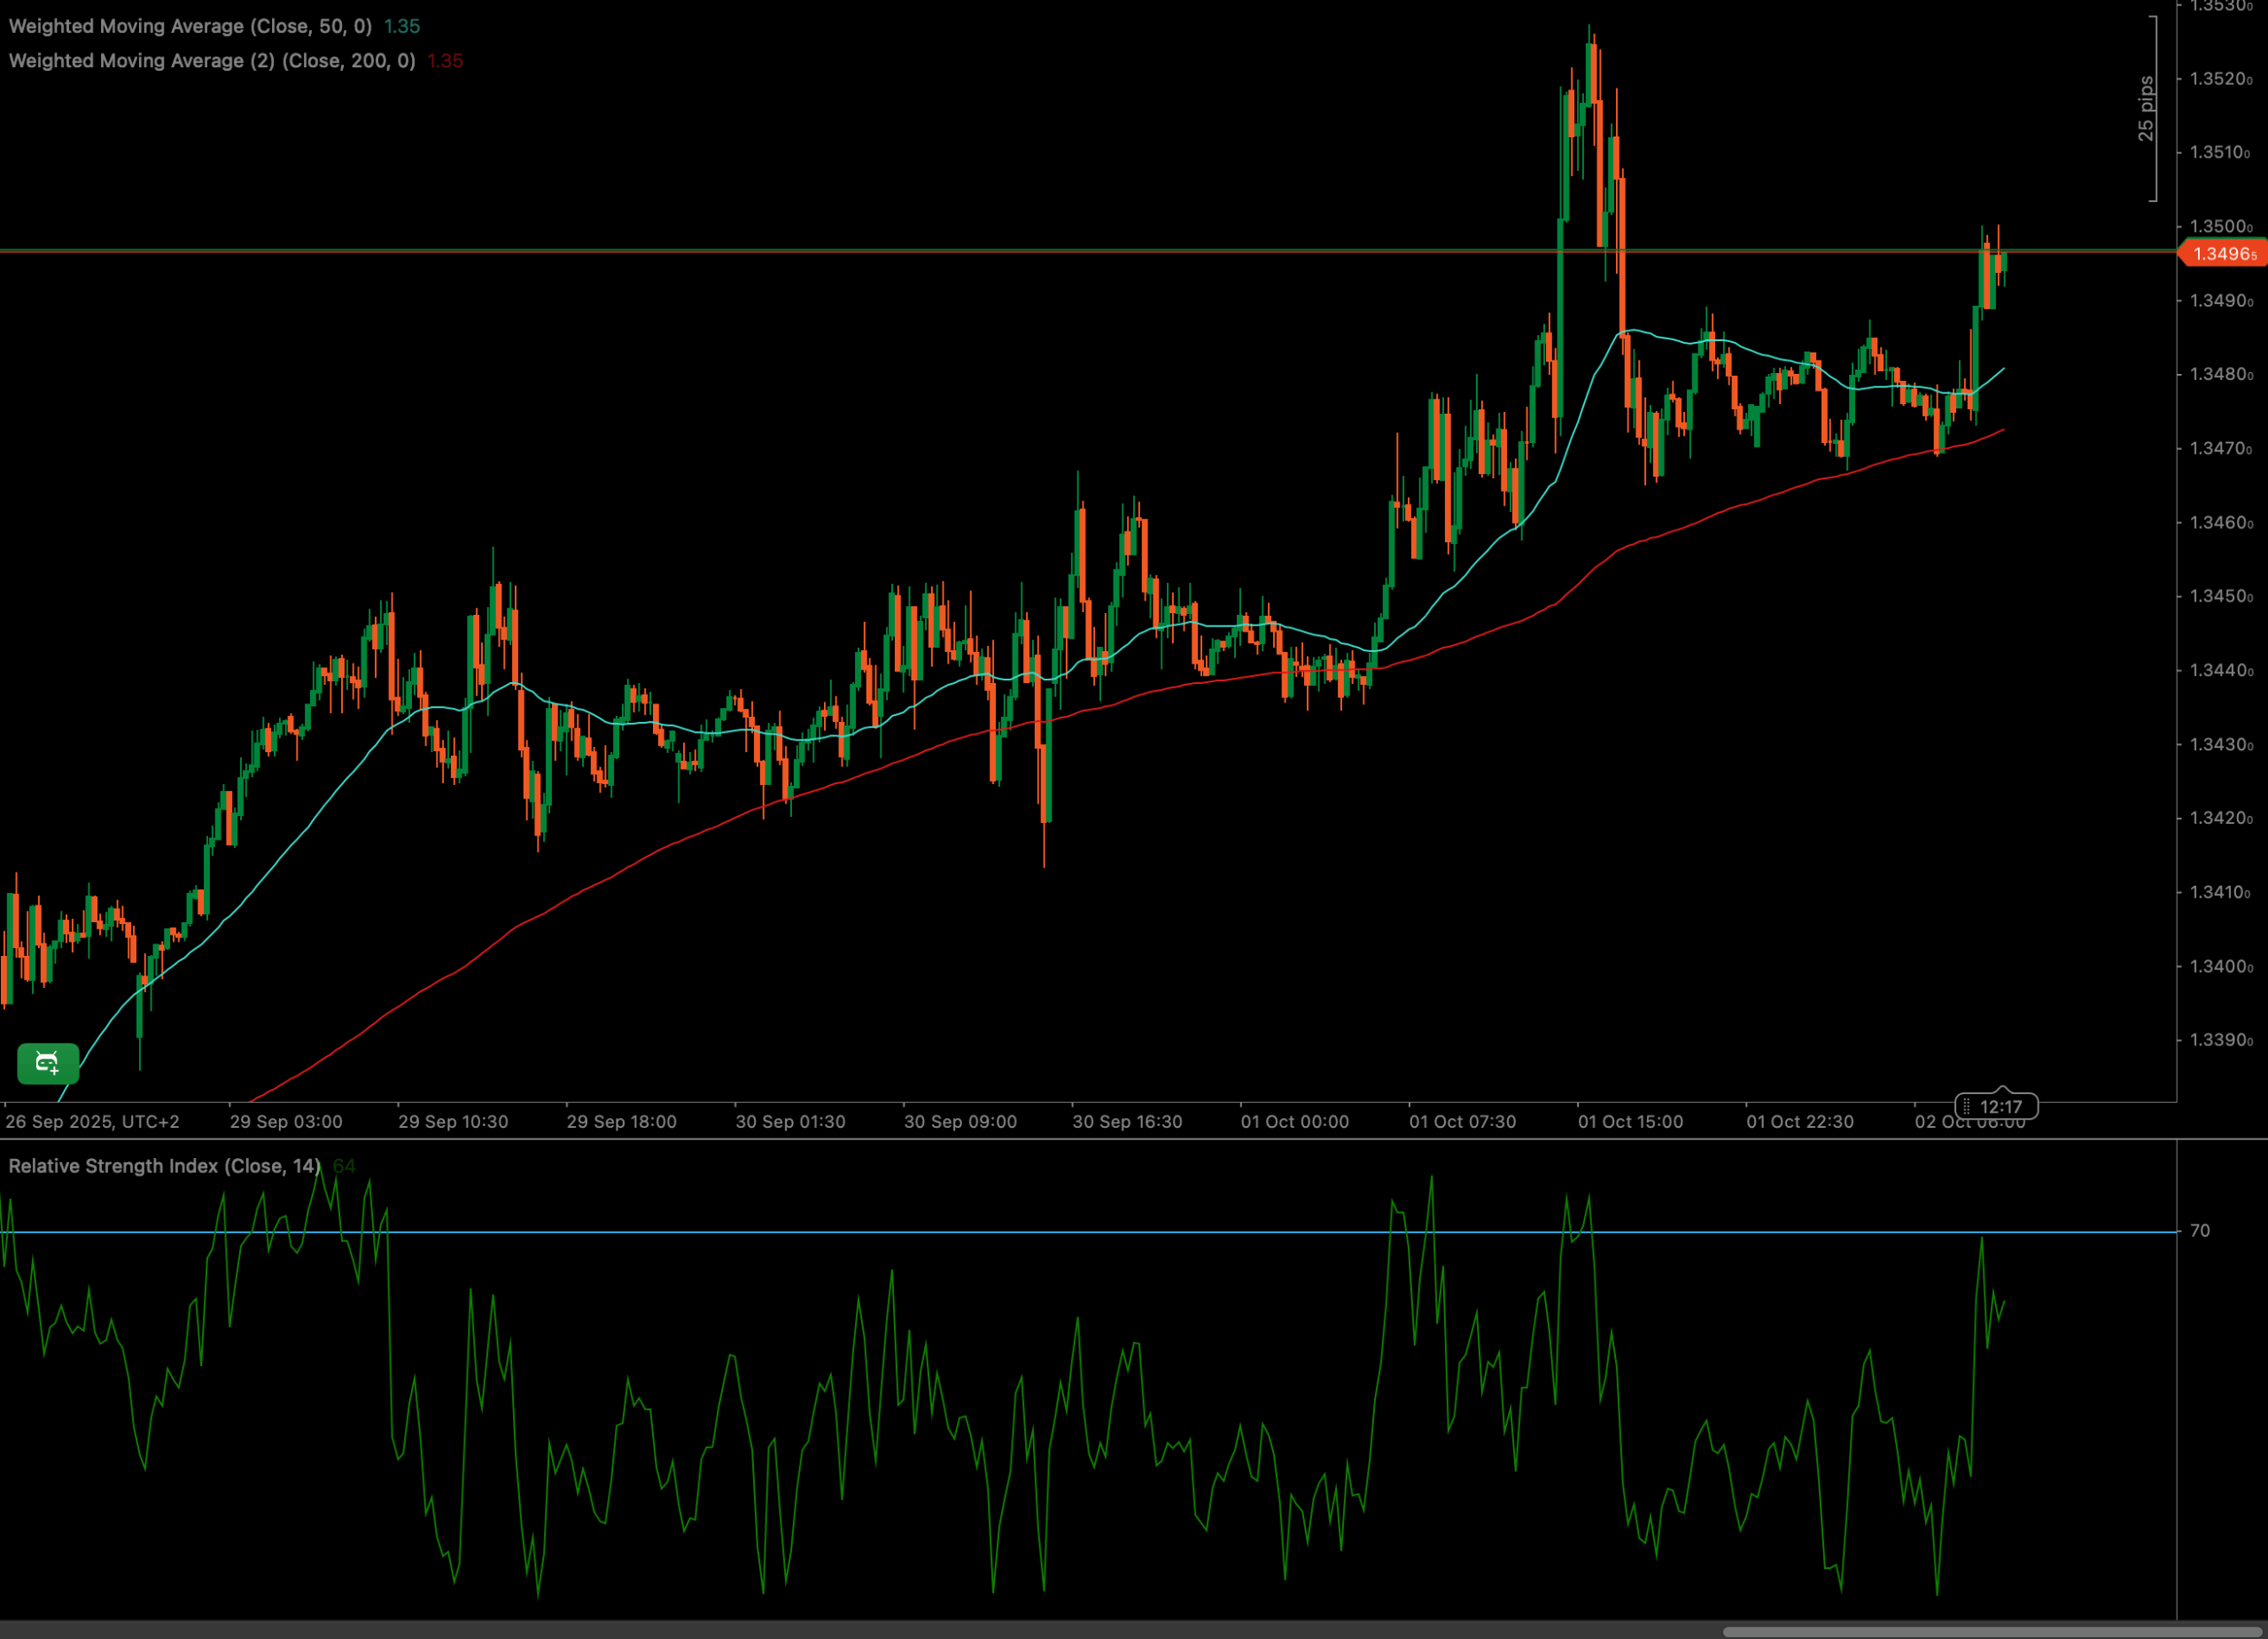
The GBPUSD has demonstrated a robust uptrend from late September, culminating in a significant price spike above 1.3520 on October 1st. Following this peak, the pair faced considerable selling pressure, leading to a correction. Currently, the price is consolidating and challenging the key horizontal resistance level around 1.3496, a pivotal point that will likely dictate the next directional move.
After its bullish surge, the GBPUSD found strong dynamic support along the 50-period Weighted Moving Average. However, the sharp rejection from the early October high has pushed the price below this short-term average, indicating a potential shift in momentum as it now navigates between key technical levels.
📈 Technical Analysis
Key Support and Resistance Levels
The immediate resistance for the GBPUSD is clearly defined at the 1.3496 level, which is currently being tested. A break above this could open the way to retest the recent peak near 1.3525. On the downside, the primary dynamic support is the 200-period WMA (red line), currently sitting around the 1.3470 area. A break below this level would signal a more significant bearish turn.
Moving Average Analysis for GBPUSD
The chart displays a bullish structure, with the 50 WMA (cyan line) positioned firmly above the 200 WMA (red line). Throughout the uptrend, the 50 WMA acted as reliable dynamic support. The recent correction, however, saw the price break below the 50 WMA, which is now acting as immediate dynamic resistance. The 200 WMA remains the crucial long-term trend support for this timeframe, and its integrity is key for the continuation of the bullish outlook.
RSI and Momentum Shift in GBPUSD
The Relative Strength Index (RSI) provided a classic overbought signal when it pushed above the 70 level concurrently with the price peak on October 1st. This heralded the subsequent reversal. Since then, the RSI has retreated into neutral territory. At the right edge of the chart, as the price re-tests resistance, the RSI is trending upwards again but remains below 70, suggesting that while bullish momentum is returning, there may still be room to move higher before conditions become overbought again.
Volume Spike and Market Participation
While specific volume data is not visible on this chart, observing volume alongside price action is crucial for confirming trends. The sharp spike and reversal on October 1st was likely accompanied by a surge in volume. Traders should monitor if the current test of the 1.3496 resistance is supported by increasing buying volume, which would validate a potential breakout for the GBPUSD.
Candlestick Tone and Market Reaction for GBPUSD
The price action for the GBPUSD shows strong, consecutive bullish candles during the uptrend. The peak on October 1st is marked by a candlestick with a long upper wick, indicating a sharp rejection and significant profit-taking. The current price action shows a series of bullish candles approaching the 1.3496 resistance level, signaling a determined effort by buyers to break through this barrier. The reaction at this level will be critical.
🔍 Market Outlook & Trading Scenarios
Bullish Scenario
If the GBPUSD achieves a convincing close above the 1.3496 resistance level, it would signal a continuation of the primary uptrend. The next logical target for bulls would be a retest of the recent high around 1.3525.
Neutral Scenario
The GBPUSD could fail to break the 1.3496 resistance and instead enter a consolidation phase. The price would likely trade in a range between the 1.3496 resistance and the 200 WMA support (around 1.3470) as the market awaits a fresh catalyst.
Bearish Scenario
A strong rejection from the 1.3496 level, followed by a decisive break below the 200 WMA, would invalidate the current bullish structure. This could trigger a deeper correction, with sellers targeting lower support levels not visible on this chart segment.
💼 Trading Considerations
- Bullish setup: Look for a confirmed breakout and close above 1.3496. A potential entry could be on the retest of this level as new support, targeting the 1.3525 area.
- Breakout setup: A clear break above 1.3496 signals a long entry. Conversely, a firm break below the 200 WMA could be a trigger for a short position.
- Bearish setup: A failed breakout at 1.3496, confirmed by bearish reversal patterns (like an engulfing candle), could offer a short opportunity targeting the 200 WMA support around 1.3470.
🏁 Conclusion
The GBPUSD is at a critical technical juncture. Its strong uptrend is being challenged at the key 1.3496 resistance level. The alignment of the moving averages still favors the bulls, but the recent price action below the 50 WMA calls for caution. The outcome of the battle at this resistance will set the tone for the pair’s direction in the near term.
Traders should closely monitor the price action around 1.3496 and the 200 WMA. A breakout would reaffirm the bullish trend, while a breakdown below the 200 WMA would signal that a more significant correction is underway for the GBPUSD.
⚠️ Disclaimer
This analysis is for informational purposes only and does not constitute financial advice. Always consult a licensed financial advisor before making trading decisions.


