📊 Market Overview
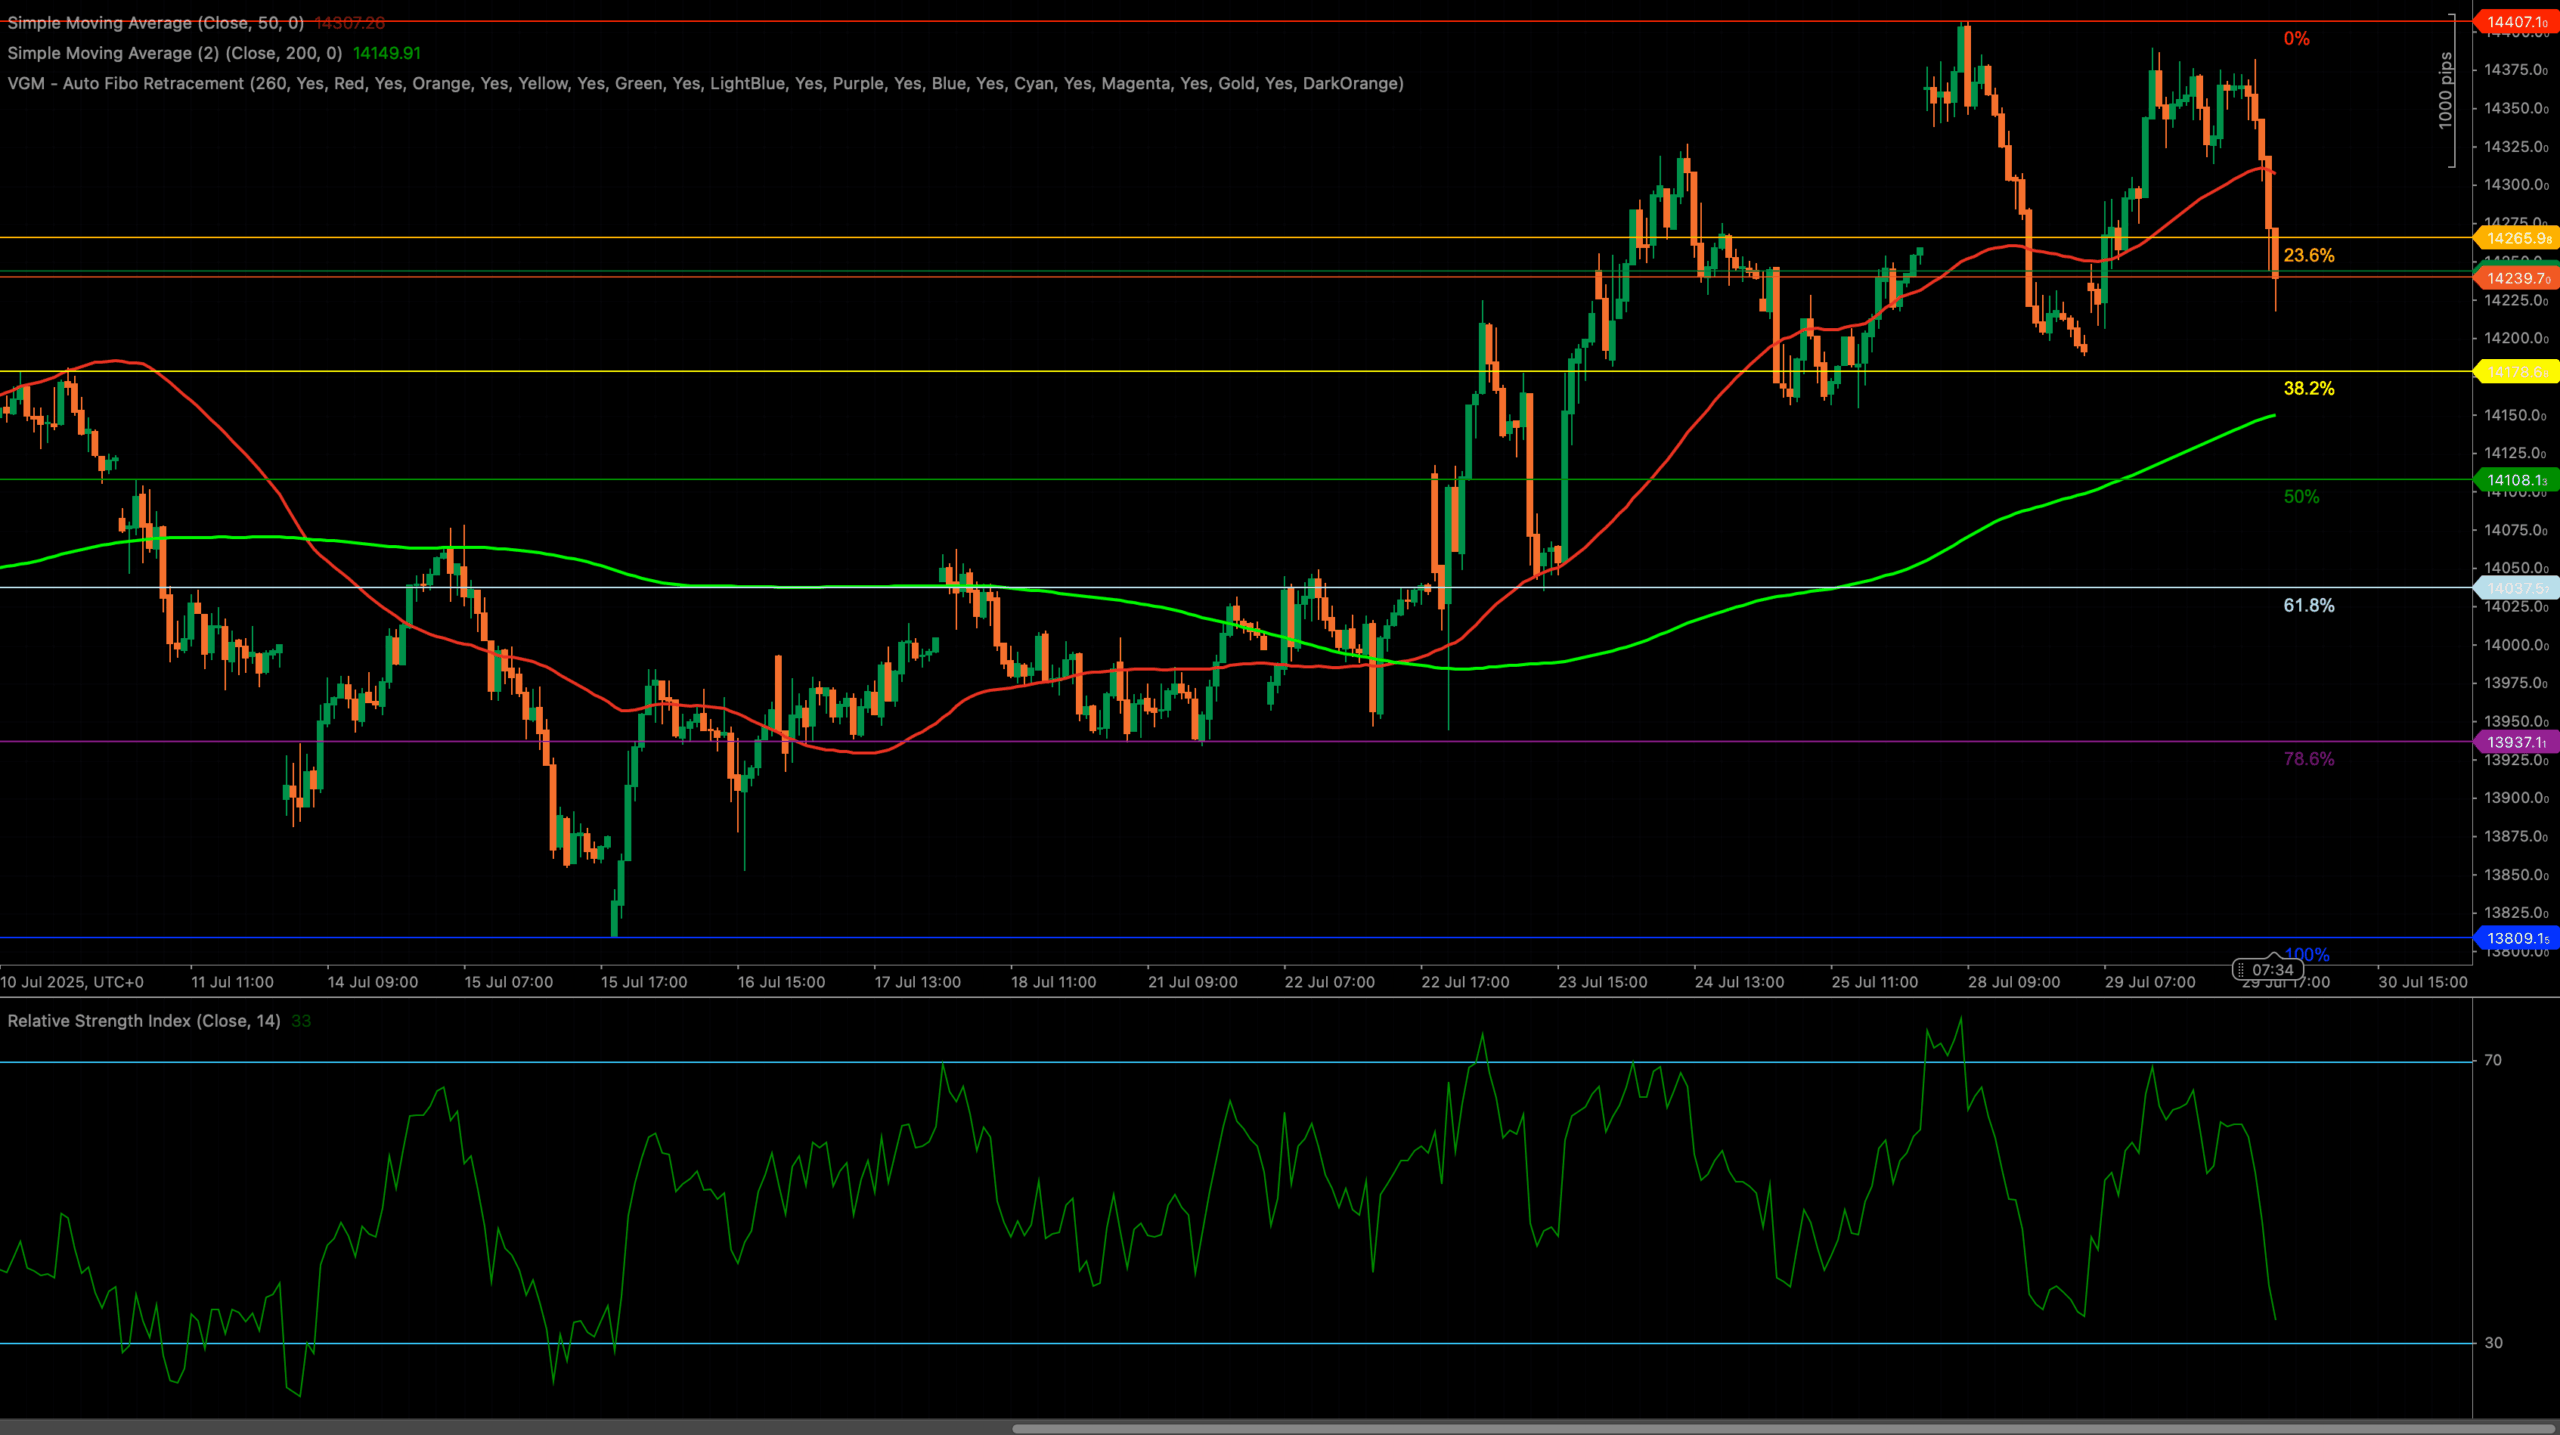
The ESP35 index has pulled back sharply after a clear rejection at the swing high of 14,407, marking the 0% Fibonacci level. Prices found temporary support at the 23.6% retracement around 14,230, where recent intraday activity shows consolidation. The 50-period simple moving average (red) near 14,290 was breached during the decline, and momentum indicators such as RSI have dropped to the low 30s, reflecting heightened bearish sentiment.
Despite the pullback, underlying structure remains relatively intact, with the 200-period moving average (green) serving as a potential support zone just above 14,105. Longer-term perception still leans cautiously bullish as price remains above key Fibonacci retracement levels and retains technical support near 14,105-14,025.
📈 Technical Analysis
Key Support and Resistance Levels
Resistance remains firmly established at 14,407, corresponding to the recent swing high, and a sustained break above this level could trigger bullish momentum toward fresh highs. Immediate support lies at 14,230, which coincides with the 23.6% Fibonacci retracement level. Should price move lower, the next notable support is at 14,105, where the 38.2% retracement aligns with the 200-period simple moving average, forming a significant confluence zone. Further downside targets include 14,025 at the 50% retracement and 13,965 at the 61.8% retracement, with deeper losses potentially reaching 13,937 (78.6%) or the swing low at 13,809 (100%).
Moving Averages and Dynamic Price Action
The 50-period SMA has just been broken, indicating short-term bearish pressure. The 200-period SMA sits at 14,105, aligned with the 38.2% retracement – a confluence zone that may attract buyers. Both moving averages remain upward-sloping, implying that despite recent weakness, longer-term momentum remains positive.
RSI Momentum and Trend Strength
The RSI has fallen to approximately 33, firmly below the neutral 50-line but not yet deeply oversold. This suggests a growing bearish bias, but oversold conditions are emerging, which may set the stage for a short-term bounce. There is no divergence visible yet, but sustained pressure below 35 could encourage range-based buying near support.
Candlestick Structure and Market Tone
Recent candlesticks show strong bearish candles accompanied by long wicks, notably near the 14,230-14,290 zone, highlighting aggressive selling with some intraday recovery attempts. Tight bodies in the most recent bars indicate consolidation rather than capitulation. Traders should watch for any bullish reversal candlestick pattern (e.g. hammer or engulfing) near support to suggest accumulation.
Fibonacci Roadmap and Target Zones
Measured from the swing low at 13,809 to the high at 14,407, the Fibonacci retracement levels outline the current trading structure. The 23.6% retracement at 14,230 serves as immediate support, where price is currently consolidating. Below this, the 38.2% level at 14,105 is reinforced by the 200-period SMA, making it a critical rebound zone. The 50% retracement at 14,025 represents a secondary support area, while the 61.8% level at 13,965 marks a deeper correction threshold. If selling pressure persists, the final retracement supports are found at 13,937 (78.6%) and the swing low at 13,809 (100%). Maintaining a hold above the 23.6% level keeps bullish prospects alive, whereas a breakdown would likely shift focus toward the 38.2% zone and beyond.
🔍 Market Outlook & Trading Scenarios
Bullish Scenario:
Holding above 14,230 allows for a rebound toward 14,290 and retest of the 14,407 high. A breakout and daily close above 14,407, coupled with RSI recovery above 50, would open the door to further gains and higher highs.
Neutral Scenario:
Choppy trading between 14,230 and 14,290 as RSI ranges between 33-50. Range-bound strategies, such as fade trades near extremes, may prove effective until momentum clarifies direction.
Bearish Scenario:
Price breaks below 14,230 and settles underneath, with RSI slipping under 30. Targets shift to 14,105 and 14,025. A break below 14,105 risks deeper pullback toward 13,965 or even 13,809.
💼 Trading Considerations
- Bullish setup: Buy near 14,230 if a bullish reversal candle forms; initial targets at 14,290 and 14,407. Tight stop loss just below 14,230.
- Bearish setup: Sell below 14,230 with confirmation; targets in the 14,105-14,025 zone, stop placed above 14,290.
- Range play: Fade the range between 14,230 and 14,290 using tight stops and momentum confirmation.
🏁 Conclusion
ESP35 faces a crucial test at the 23.6% Fibonacci retracement near 14,230, with RSI crossing into oversold territory near 33 and the 50-period SMA now offering resistance from above. While short-term momentum favors the bears, the 200-period SMA and 38.2% Fib at 14,105 remain key support levels. Holding above 14,230 keeps bulls in contention, with the breakout above 14,407 needed to reassert strong upward momentum. A break below 14,230, however, would shift the bias toward a deeper retracement.
⚠️ Disclaimer
This analysis is for informational purposes only and does not constitute financial advice. Always consult a licensed financial advisor before making trading decisions.


