
📊 Market Overview
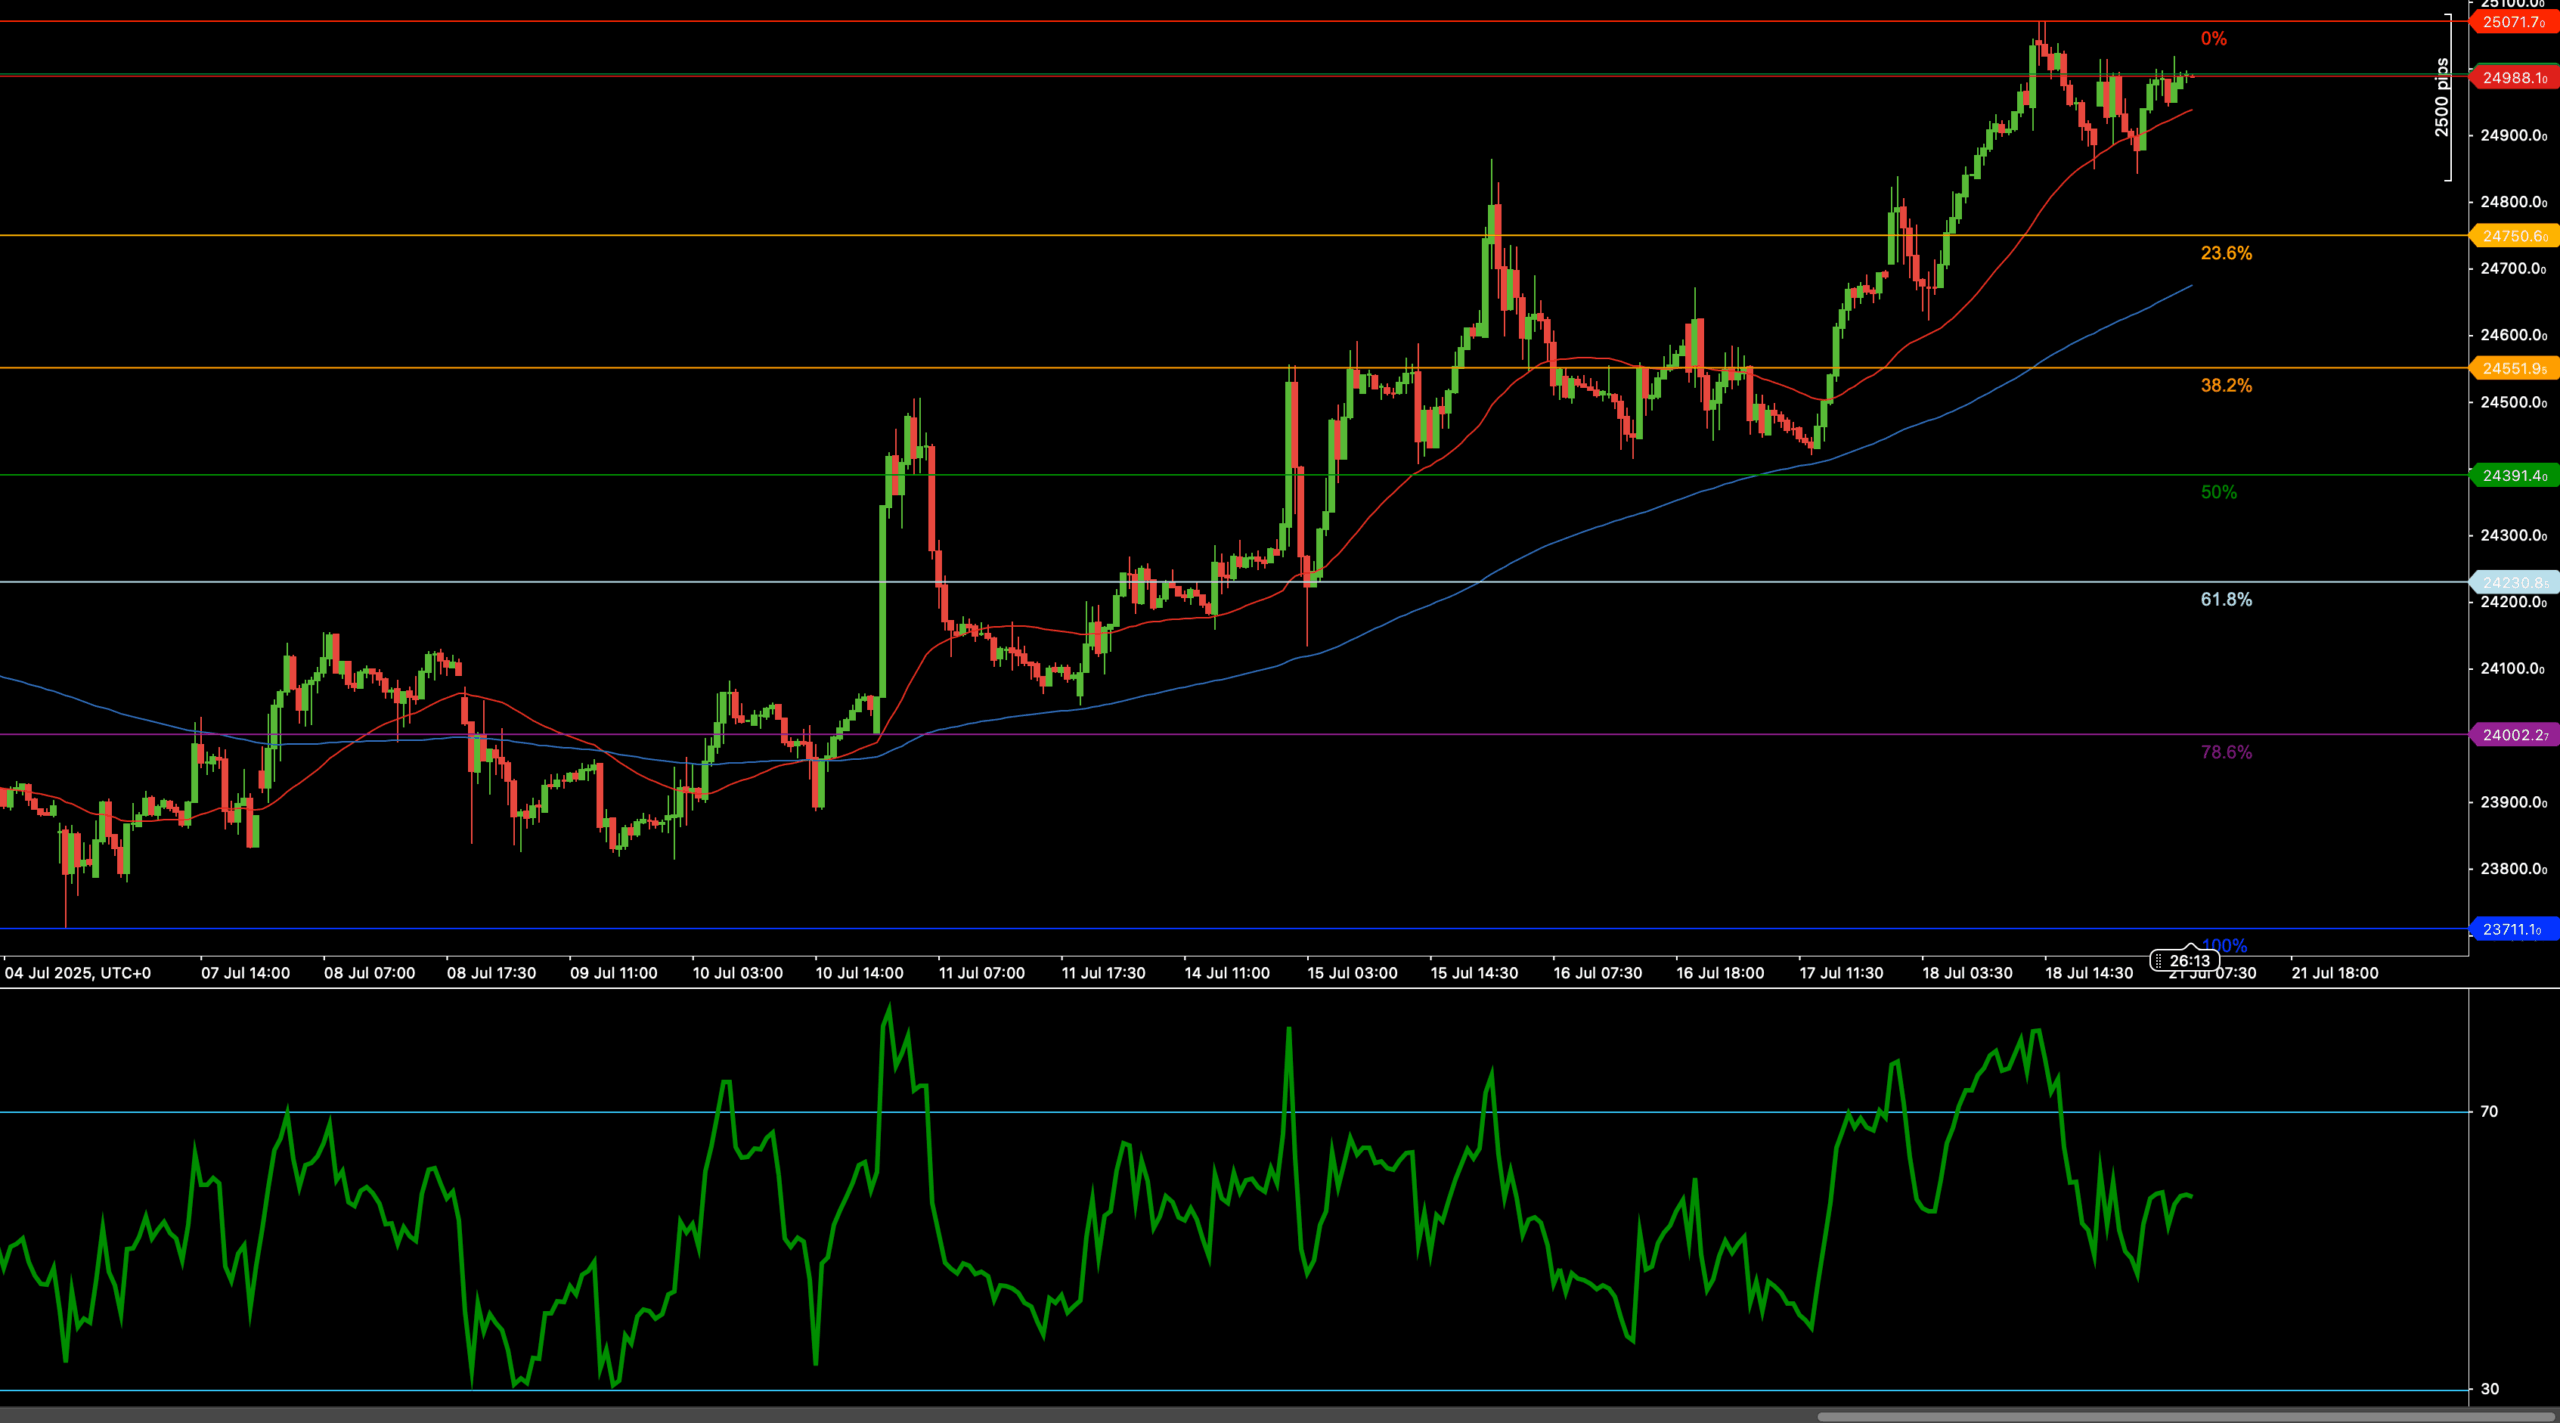
The HSI50 index has extended its rally from the July low, surging over 800 points before encountering heavy resistance at the round-number level of 25,000 — a psychological threshold that often coincides with profit-taking and hesitation. The price topped at 25,017.8 and has since entered a sideways consolidation. Despite this stall, bullish structure remains dominant, supported by rising 50- and 200-period moving averages and sustained RSI readings above the midline.
Macroeconomic sentiment in Asia remains cautiously optimistic, supporting equity inflows into Hong Kong and Chinese tech-heavy sectors. However, the absence of follow-through above 25,000 raises the possibility of a corrective move before bulls attempt a full breakout.
📈 Technical Analysis
Key Support and Resistance Levels
Immediate resistance remains at 25,017.8, the swing high from earlier this session. A confirmed breakout above this level could unlock bullish continuation toward the 25,200–25,300 extension zone. On the flip side, support now rests at 24,768.6 — the 23.6% Fibonacci retracement of the recent July leg. If broken, the next area of interest is 24,551.5 (38.2% Fib) followed by deeper support at 24,391.4 (50%).
Moving Averages and Dynamic Price Action
The 50-period moving average continues to track closely beneath price action, offering dynamic support around 24,600. The 200-period MA, while lagging below 24,300, also maintains a positive slope, indicating broader bullish strength. This confluence of rising averages lends credence to the idea that current consolidation may serve as a launchpad rather than a reversal point.
RSI Momentum and Trend Strength
The RSI is currently holding just below overbought levels but remains well above 50 — a signal of enduring bullish momentum. Although some divergence may be developing, there is no clear sign yet of a trend reversal. A fresh RSI push above 65–70 could preface a breakout toward the next price extensions.
Candlestick Structure and Market Tone
Recent candlesticks show reduced volatility and tight-bodied candles near the 25,000 resistance, reflecting equilibrium between bulls taking profit and new buyers accumulating. No clear bearish reversal patterns have emerged, and price continues to respect short-term support trendlines. If a bullish engulfing pattern forms near the highs, it could trigger renewed upside momentum.
Chart Structure and Trend Integrity
Structurally, the market is maintaining a strong uptrend: higher highs, higher lows, and repeated bounces off moving averages confirm that buyers are still in control. The recent move above the previous swing high around 24,800 marked a key trend continuation signal. Only a sustained drop below 24,550 would threaten the current uptrend.
Fibonacci Roadmap and Target Zones
The Fibonacci retracement levels from the July swing low to the 25,017.8 high show key support at 24,768.6 (23.6%), 24,551.5 (38.2%), and 24,391.4 (50%). As long as these levels hold, traders can anticipate bullish continuation toward 25,200 and 25,375 (extension targets). A breakdown below 24,391.4 would shift the bias toward neutral.
🔍 Market Outlook & Trading Scenarios
Bullish Scenario:
A break and daily close above 25,017.8, especially with RSI reclaiming the 65–70 zone, would signal breakout continuation. Targets include 25,200 and 25,375. Bullish bias remains valid above 24,768.
Neutral Scenario:
Sideways action between 24,768 and 25,017 would imply consolidation. RSI may range between 50 and 65. Mean-reversion setups could work well in this environment.
Bearish Scenario:
A break below 24,551 with RSI falling under 45 would indicate weakening momentum and open the door to a move toward 24,391 or even 24,200 (61.8% retracement).
💼 Trading Considerations
- Bullish setup: Buy breakout above 25,017 targeting 25,200 and 25,375. Stop loss below 24,768
- Bearish setup: Sell breakdown below 24,551 targeting 24,391 and 24,200. Stop above 25,017
- Range play: Fade the 24,768–25,017 range with momentum confirmation and tight stops
🏁 Conclusion
The HSI50 remains in a technically bullish posture, consolidating just below the critical 25,000 barrier. As long as price holds above 24,768 and moving averages continue to rise, the path of least resistance remains upward. A breakout above 25,017 would confirm trend continuation — but caution is warranted near resistance extremes.
⚠️ Disclaimer
This analysis is for informational purposes only and does not constitute financial advice. Always consult a licensed financial advisor before making trading decisions.


