📊 MARKET OVERVIEW
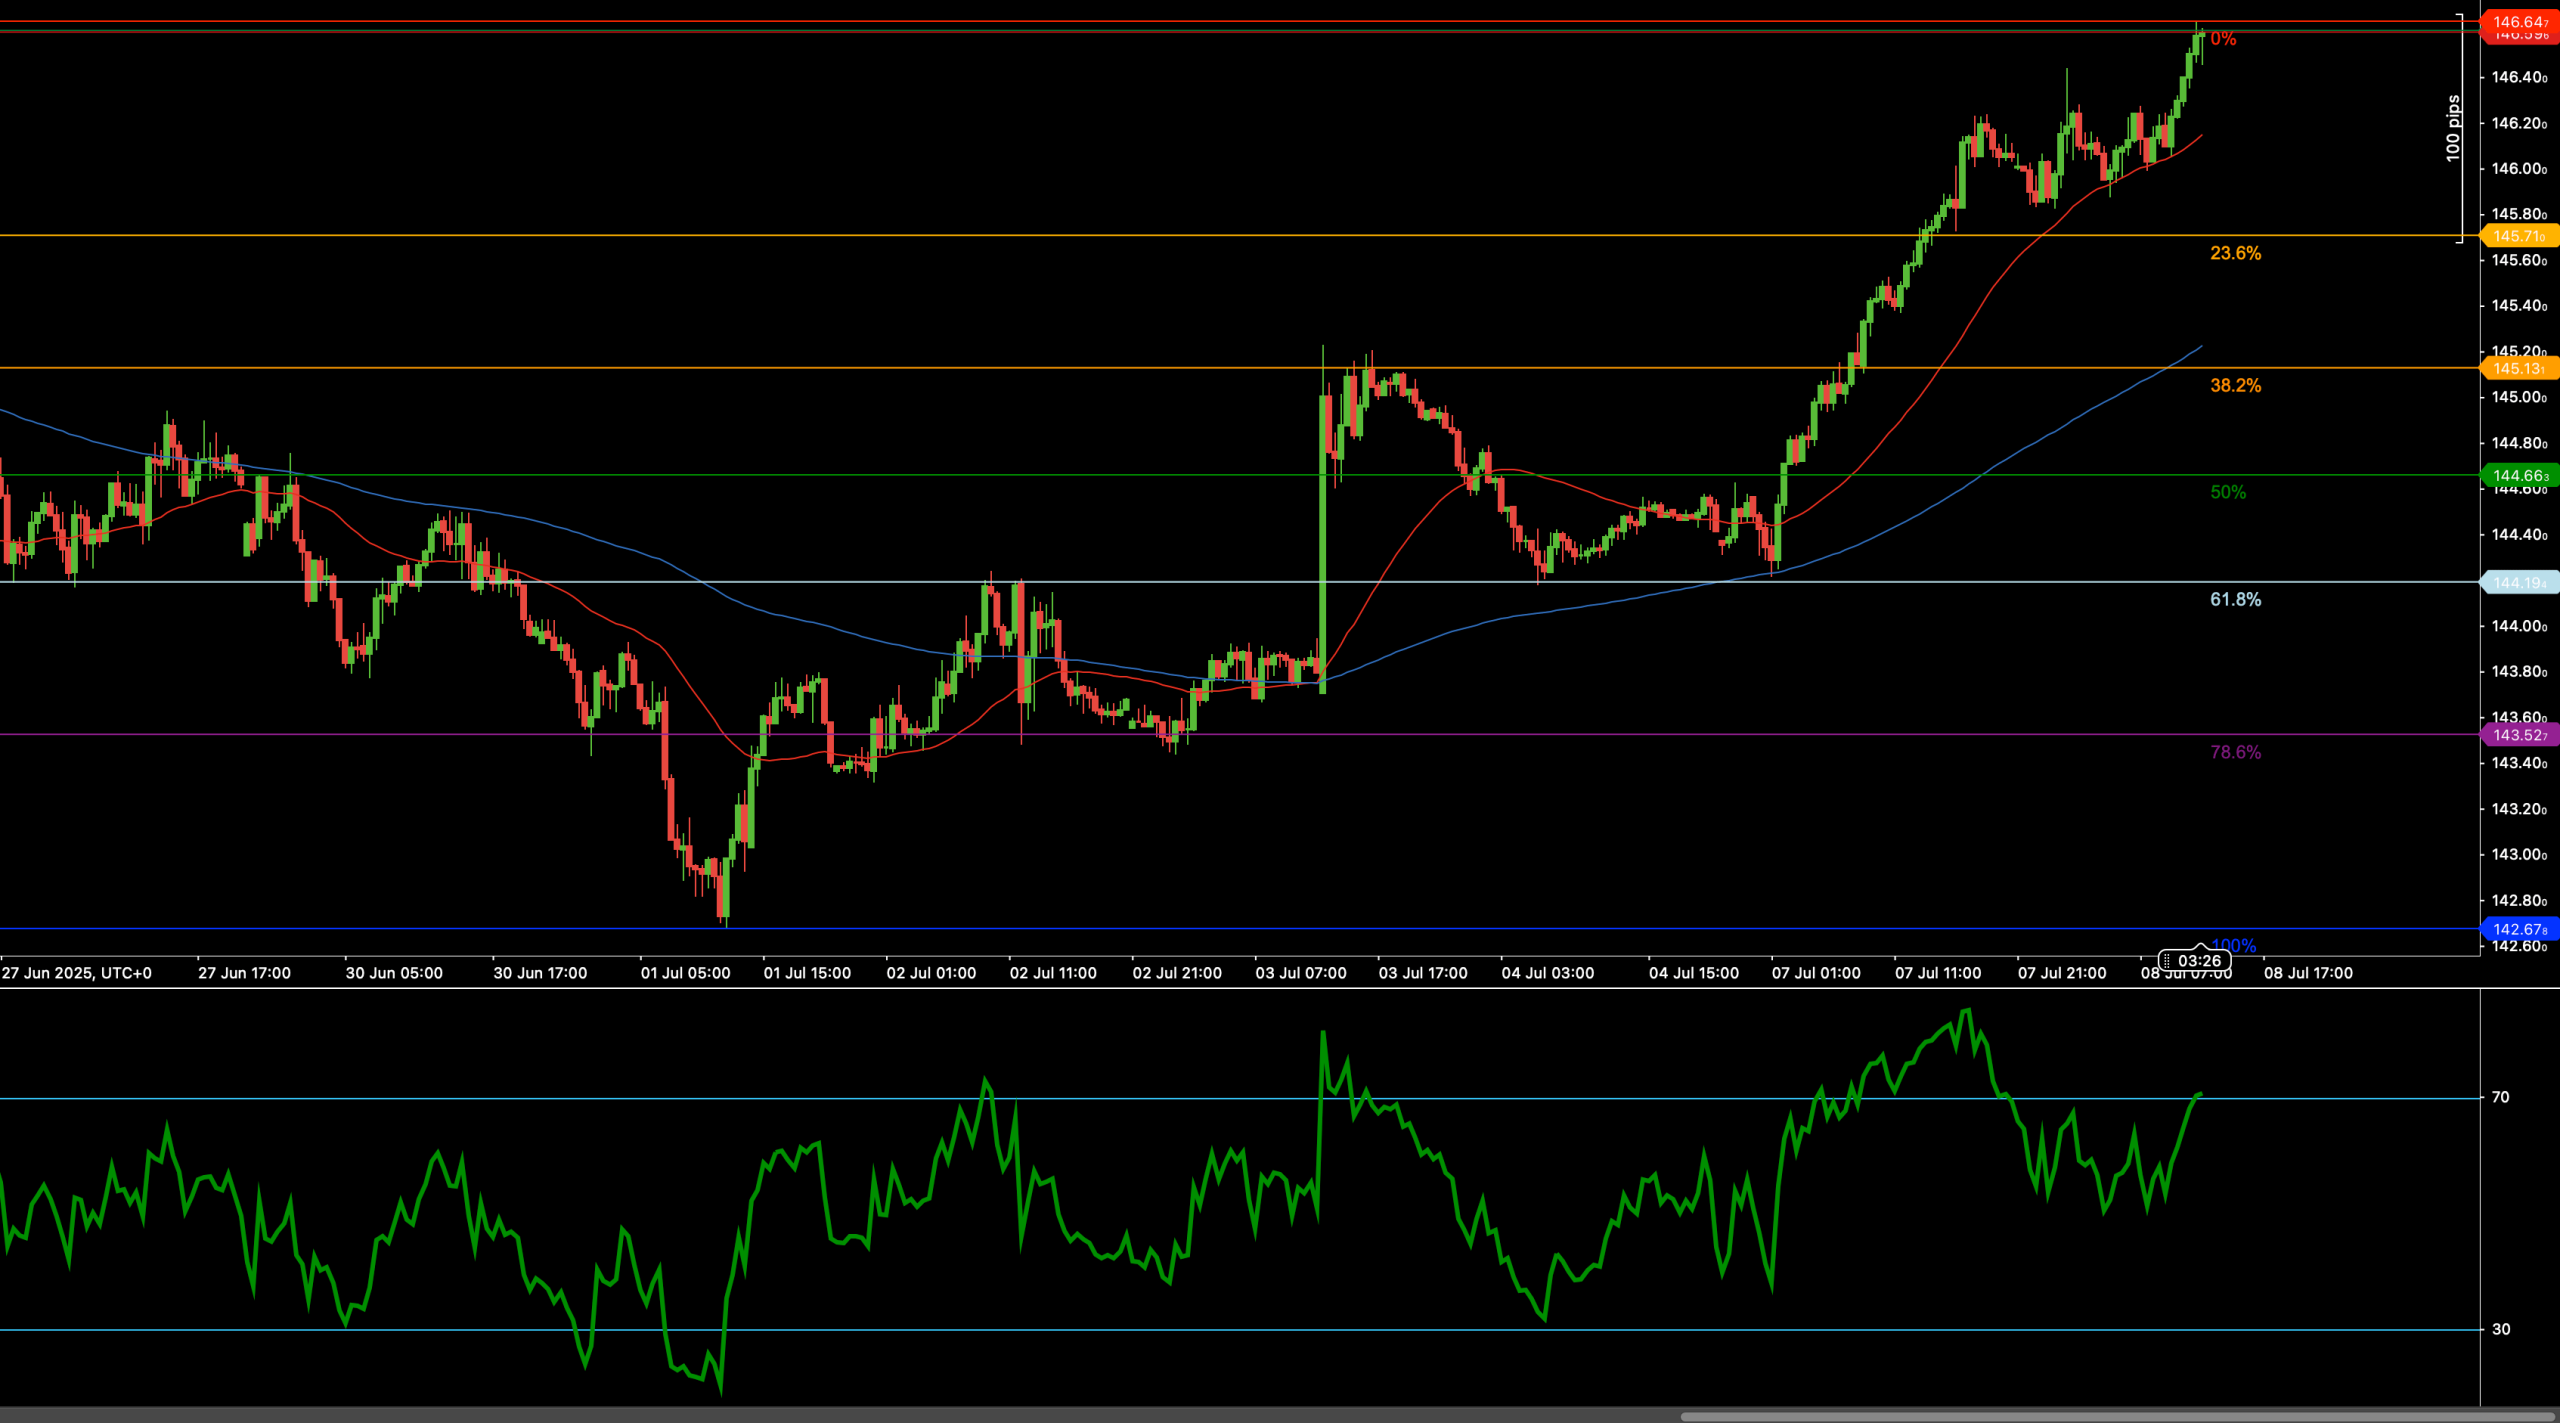
USD/JPY has resumed its bullish momentum, decisively breaking above the prior resistance zone near 146.60. This move follows several days of consolidation and is supported by broad-based dollar strength amid rising US yields. The pair now trades at fresh highs, extending the uptrend that began in late June. Key support has shifted higher to 145.75, aligned with the 23.6% Fibonacci retracement of the latest rally. Rising moving averages and a bullish RSI reading confirm the uptrend remains intact, although overbought conditions may prompt short-term pauses. Traders are watching for follow-through toward 147.20 and 147.85 while guarding against sudden pullbacks toward dynamic supports.
📈 TECHNICAL ANALYSIS
Key Support and Resistance Levels
The nearest support is now at 145.75, marked by the 23.6% Fibonacci retracement. Below that, additional support sits at 145.10, near the 38.2% retracement and the rising 200-WMA. Stronger downside protection lies at 144.35, the 50% retracement. On the upside, resistance targets are 147.20, followed by 147.85, where Fibonacci expansions and historical pivot points converge.
Moving Averages and Dynamic Price Action
USD/JPY trades well above both the 50- and 200-period weighted moving averages, reflecting strong bullish momentum. The 50-WMA continues to rise sharply, currently offering support near 145.00, while the 200-WMA remains lower near 144.00. The steep positive slope of these averages suggests that dips are likely to attract fresh buying interest. Unless price decisively breaks below these dynamic supports, the trend bias remains bullish.
RSI Momentum and Trend Strength
The 14-period RSI has surged above 70, indicating strong bullish momentum but also suggesting that the pair may be nearing overbought territory. While RSI above 70 confirms bullish strength, traders should monitor for potential bearish divergence or a pullback toward the 55–60 zone for trend validation. Sustained RSI strength above 60 would continue to favor upside follow-through.
Candlestick Structure and Market Tone
Recent candlestick formations highlight a strong bullish breakout with large-bodied candles closing near session highs. The absence of bearish reversal patterns reinforces the upward momentum. A continuation of impulsive candles above 146.60 would confirm that bulls remain firmly in control. Traders should watch for potential pause candles or shooting stars near the next resistance zones as signs of exhaustion.
Chart Structure and Trend Integrity
The broader chart structure confirms a classic bullish trend of higher highs and higher lows. The sharp rally from early July marks a clean breakout phase, and the absence of deeper pullbacks indicates strong underlying demand. Unless price breaks below the 145.75–145.10 support band, the trend structure remains firmly positive.
Fibonacci Roadmap and Target Zones
The Fibonacci retracement from the July swing low to the recent high places support at 145.75 (23.6%), with deeper levels at 145.10 (38.2%) and 144.35 (50%). On the upside, the next Fibonacci expansion levels align with 147.20 and 147.85, offering the next logical targets for bullish continuation.
🔍 MARKET OUTLOOK & TRADING SCENARIOS
Bullish Scenario
A sustained close above 146.60, combined with RSI holding above 60, confirms the bullish breakout. Upside targets are 147.20 and 147.85, with further extension possible toward 148.50 if momentum remains strong.
Neutral Scenario
If USD/JPY consolidates between 145.75 and 146.60, the market may pause to digest recent gains. RSI would likely hover between 55 and 70. Traders may look for range-trading opportunities while awaiting the next breakout.
Bearish Scenario
A failure to hold above 145.75, especially with RSI dropping below 50, would suggest a deeper pullback toward 145.10 and possibly 144.35. This would mark a short-term corrective phase but would not necessarily reverse the broader uptrend.
💼 TRADING CONSIDERATIONS
• Bullish setup: Buy breakout above 146.60, targeting 147.20 and 147.85. Stop loss below 145.75.
• Bearish setup: Sell breakdown below 145.75, targeting 145.10 and 144.35. Stop above 146.60.
• Range play: Fade the 145.75–146.60 band with tight stops and RSI confirmation.
🏁 CONCLUSION
USD/JPY has broken through key resistance at 146.60, extending its bullish trend with solid momentum indicators supporting the move. As long as the pair holds above 145.75, the path of least resistance remains to the upside, targeting 147.20 and 147.85 in the near term. Traders should monitor RSI and candlestick signals for confirmation of the next directional impulse.
⚠️ DISCLAIMER
This analysis is for informational purposes only and does not constitute financial advice. Always consult a licensed financial advisor before making investment decisions.


