
📊 MARKET OVERVIEW
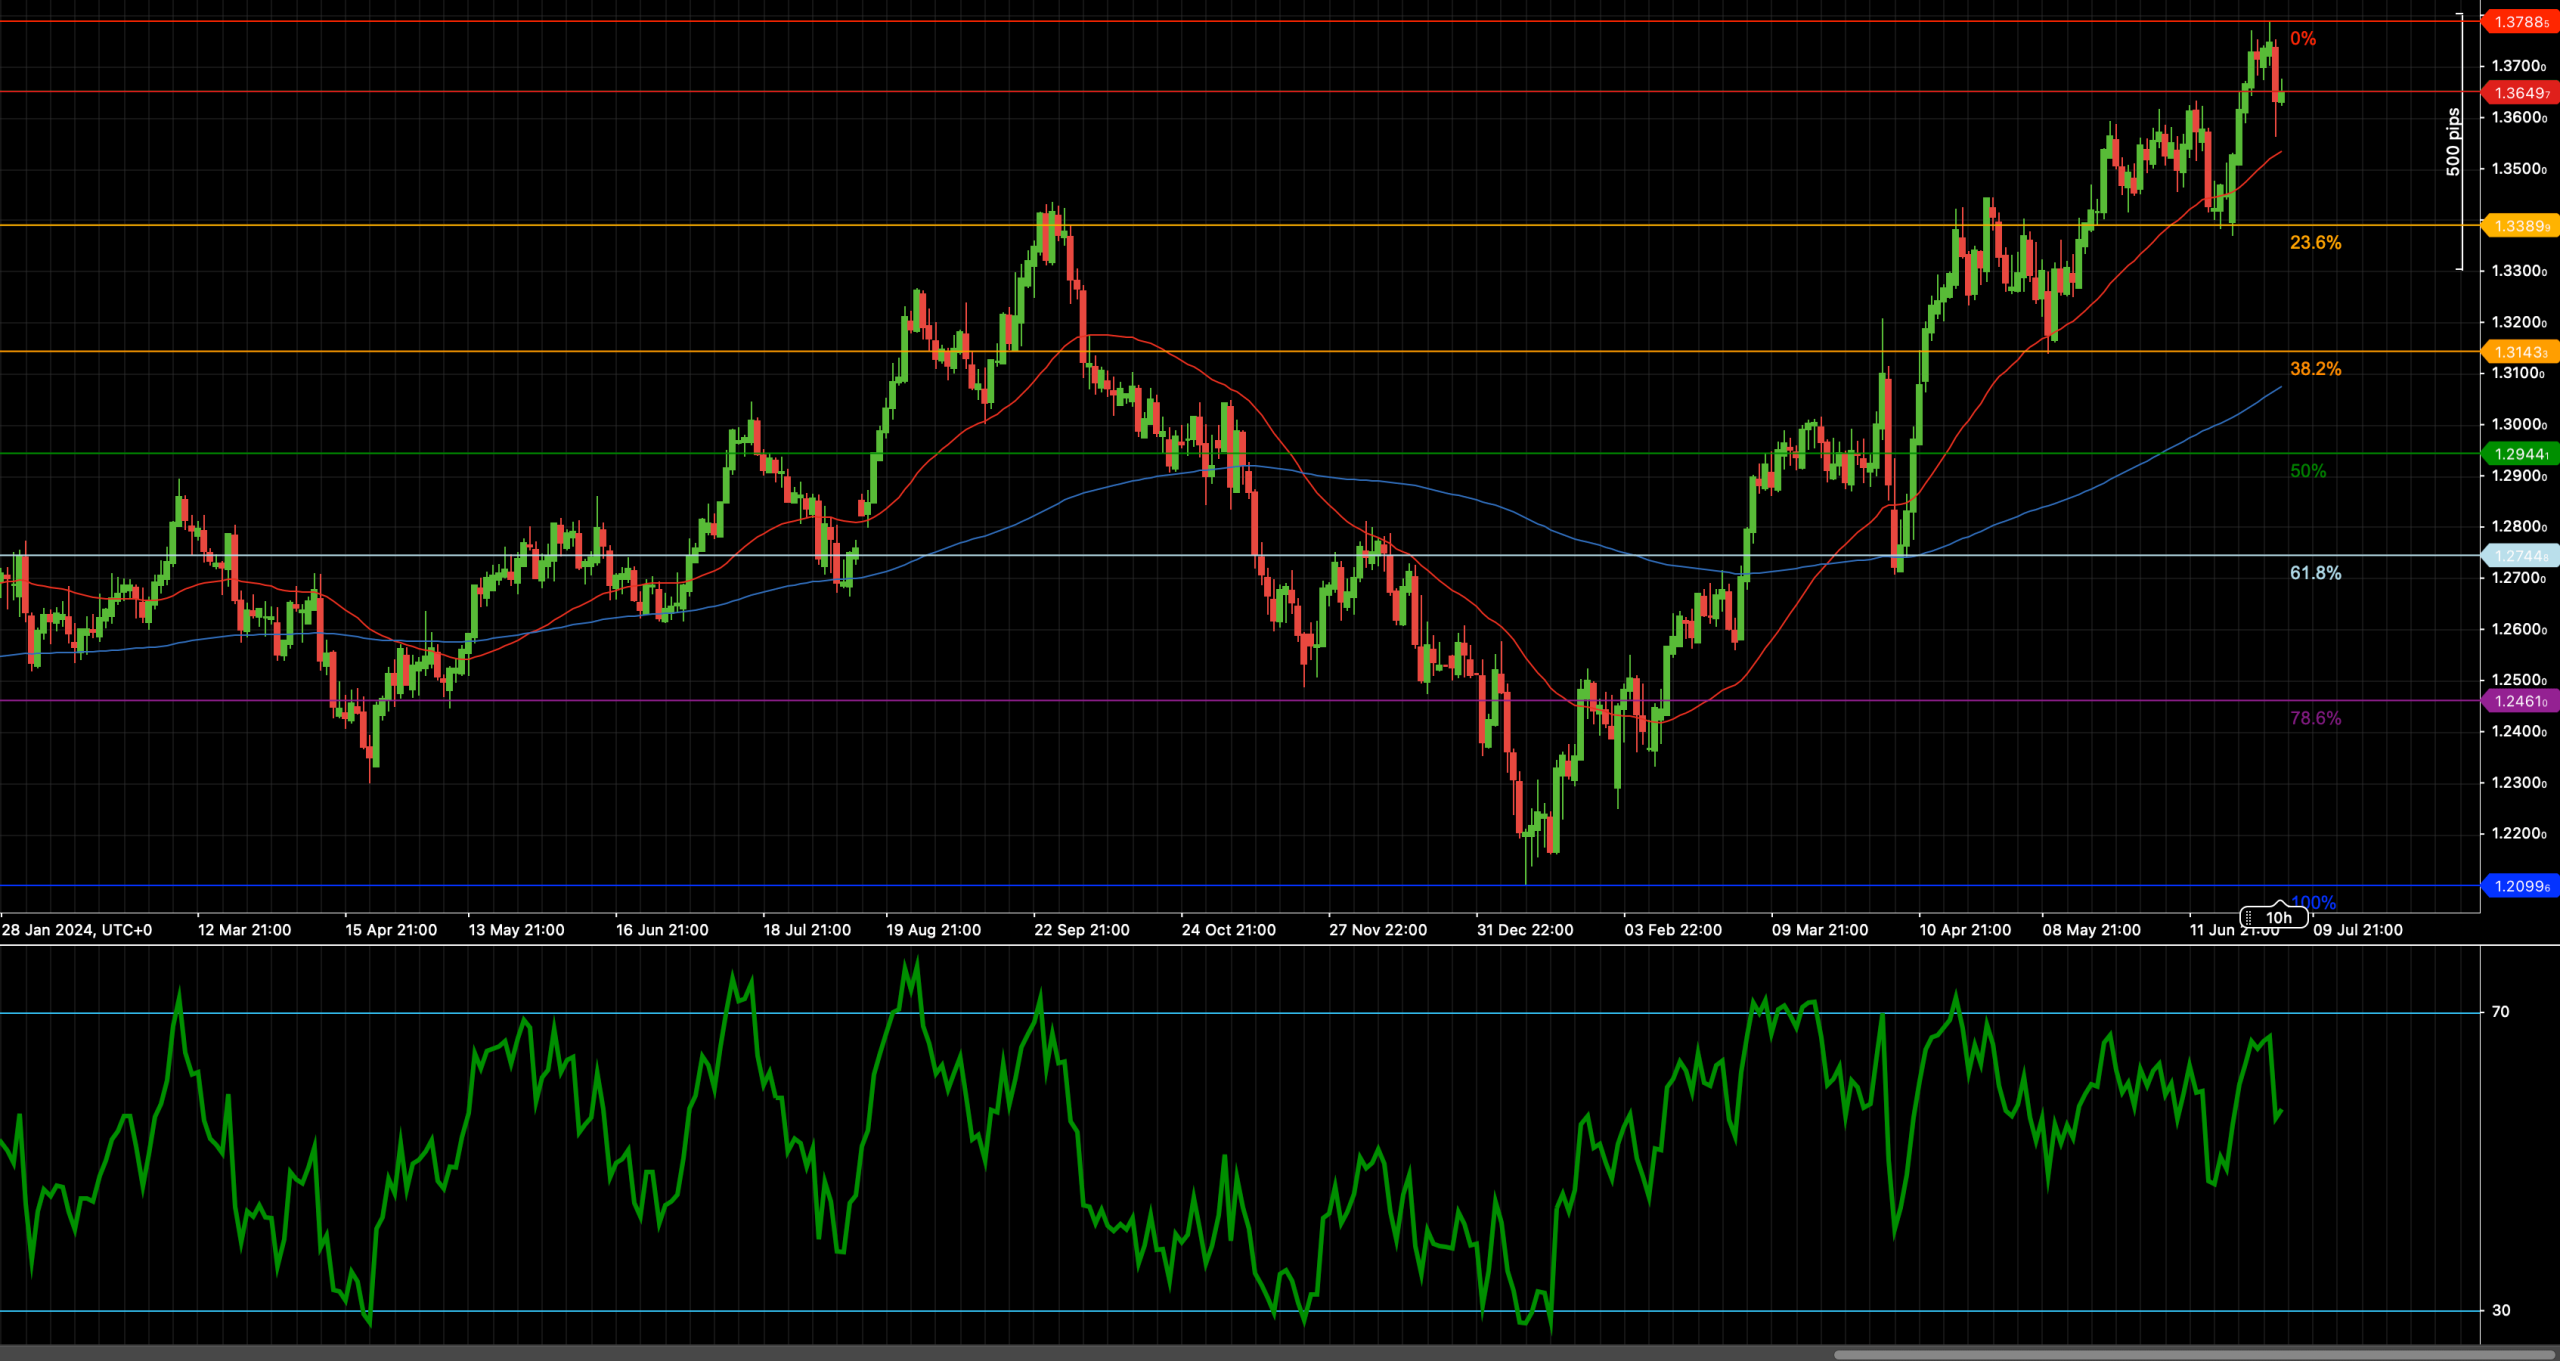
GBP/USD remains within a well-defined uptrend, pausing below the significant 1.3788 resistance level. This area represents both a prior swing high and a psychological barrier, creating a technical ceiling for the pair in the near term. The March–June rally propelled the pair from the 1.2450 zone up toward current levels, supported by favorable UK economic data and broader US dollar softness. Despite a minor pullback, the pair remains well-supported by the 23.6% Fibonacci retracement at 1.3460, which also coincides with the rising 200-period weighted moving average (WMA). These technical factors provide a strong foundation for the prevailing uptrend. Traders now await either a decisive breakout above 1.3788 to confirm trend continuation or a break below support levels to suggest a corrective phase.
📈 TECHNICAL ANALYSIS
Key Support and Resistance Levels
The immediate technical landscape highlights 1.3460 as the key short-term support, aligning with the 23.6% Fibonacci retracement and the 200-WMA. Below this zone, the next area of interest lies at 1.3140, near the 38.2% retracement, followed by a deeper support region near 1.2944 at the 50% retracement level. On the topside, resistance is clearly marked by the 1.3788 high. A breakout above this level would open the door toward 1.3850 and 1.3920, with the psychological 1.4000 handle serving as a longer-term upside target if momentum strengthens further.
Moving Averages and Dynamic Price Action
GBP/USD remains above both its 50- and 200-period WMAs, reinforcing the bullish trend. The 50-WMA, now climbing near 1.3350, has repeatedly served as a launchpad for bullish swings, while the 200-WMA near 1.3460 underpins the broader trend. The moving averages’ positive slopes indicate that the recent price pause is likely a consolidation within the uptrend rather than a trend reversal. Price holding above these dynamic levels suggests continued bullish control unless a sustained break occurs below the 200-WMA.
RSI Momentum and Trend Strength
The 14-period RSI has retreated modestly from its recent peaks but remains comfortably above the neutral 50 level, suggesting that bullish momentum persists despite the short-term pause. A rebound in RSI above 60 would likely accompany a breakout above 1.3788, while a decline below 45 would hint at a deeper correction. Traders should monitor RSI trendlines and potential divergence patterns for early clues of directional changes.
Candlestick Structure and Market Tone
Candlestick patterns in recent sessions highlight consolidation near resistance, with narrow-bodied candles and subdued volatility reflecting market indecision. Importantly, there are no strong bearish reversal patterns such as engulfing candles or evening stars, reinforcing the view that this is a pause rather than the start of a decline. A bullish engulfing candle or an impulsive close above 1.3788 would mark fresh upside intent.
Chart Structure and Trend Integrity
The broader chart structure continues to reflect a healthy bullish trend, characterized by higher highs and higher lows. The current consolidation zone above 1.3460 fits the pattern of shallow pullbacks within an ongoing uptrend. A sustained break below 1.3140 would mark a more meaningful shift in trend structure toward neutral-bearish, but until then, the overall picture favors the bulls.
Fibonacci Roadmap and Target Zones
The Fibonacci retracement drawn from the March swing low to the June peak outlines the key technical levels. Support at the 23.6% retracement (1.3460) has held thus far, while the next levels below are the 38.2% retracement at 1.3140 and the 50% retracement at 1.2944. On the upside, a confirmed break above 1.3788 opens extension targets at 1.3850 and 1.3920, with room for further advances toward 1.4000 if bullish momentum accelerates.
🔍 MARKET OUTLOOK & TRADING SCENARIOS
Bullish Scenario
A sustained daily close above 1.3788, ideally with RSI reclaiming the 60+ zone, would confirm a breakout scenario. Bullish targets lie at 1.3850 and 1.3920, with potential to extend toward 1.4000 if buying pressure accelerates. Continued support from the 50-WMA and 200-WMA would validate the bullish structure.
Neutral Scenario
If GBP/USD remains contained between 1.3460 and 1.3788, the pair is likely to drift sideways in consolidation. RSI would stabilize between 45 and 60, reflecting a lack of directional momentum. Traders may look for range-fading strategies within this band until a breakout or breakdown occurs.
Bearish Scenario
A decisive break below 1.3460, combined with RSI slipping below 45, would indicate a bearish shift. In this case, the next downside targets would be 1.3140 and 1.2944, suggesting a corrective phase. A break below 1.3140 would likely alter the medium-term trend from bullish to neutral or bearish.
💼 TRADING CONSIDERATIONS
• Bullish setup: Buy breakout above 1.3788, targeting 1.3850 and 1.3920. Stop loss below 1.3460.
• Bearish setup: Sell breakdown below 1.3460, targeting 1.3140 and 1.2944. Stop above 1.3788.
• Range play: Fade both sides of the 1.3460–1.3788 zone, using tight stops and RSI confirmation.
🏁 CONCLUSION
GBP/USD remains in a bullish technical setup despite the near-term pause below 1.3788 resistance. As long as the price holds above dynamic supports like the 200-WMA and the 23.6% retracement at 1.3460, the bias favors upside continuation. A confirmed breakout above 1.3788 would likely trigger the next bullish leg toward 1.3850 and 1.3920, while failure to hold above 1.3460 would raise caution for a deeper correction. Traders should continue monitoring RSI behavior and price action around key levels to gauge the next directional move.
⚠️ DISCLAIMER
This analysis is for informational purposes only and does not constitute financial advice. Always consult a licensed financial advisor before making investment decisions.


