
📊 MARKET OVERVIEW
EUR/GBP remains trapped in a narrow consolidation channel just above the 78.6% Fibonacci retracement at 0.8520. After peaking near 0.8575 earlier in the month, the pair has gradually faded toward deeper retracement zones but has found temporary footing at this significant technical level. The price structure now appears more neutral than outright bearish, and a meaningful close outside the current 0.8512–0.8540 band will be required to resolve directional bias.
Fundamentally, there’s been little catalyst to break the deadlock. Macro spreads between the eurozone and the UK have narrowed, and the cross seems to be following pure technical behavior. Traders remain hesitant ahead of incoming inflation prints and rate expectations, with no dominant currency tilt. Until such shifts emerge, EUR/GBP may remain within this sideways trajectory, defined by familiar support and resistance extremes.
📈 TECHNICAL ANALYSIS
Key Support and Resistance Levels
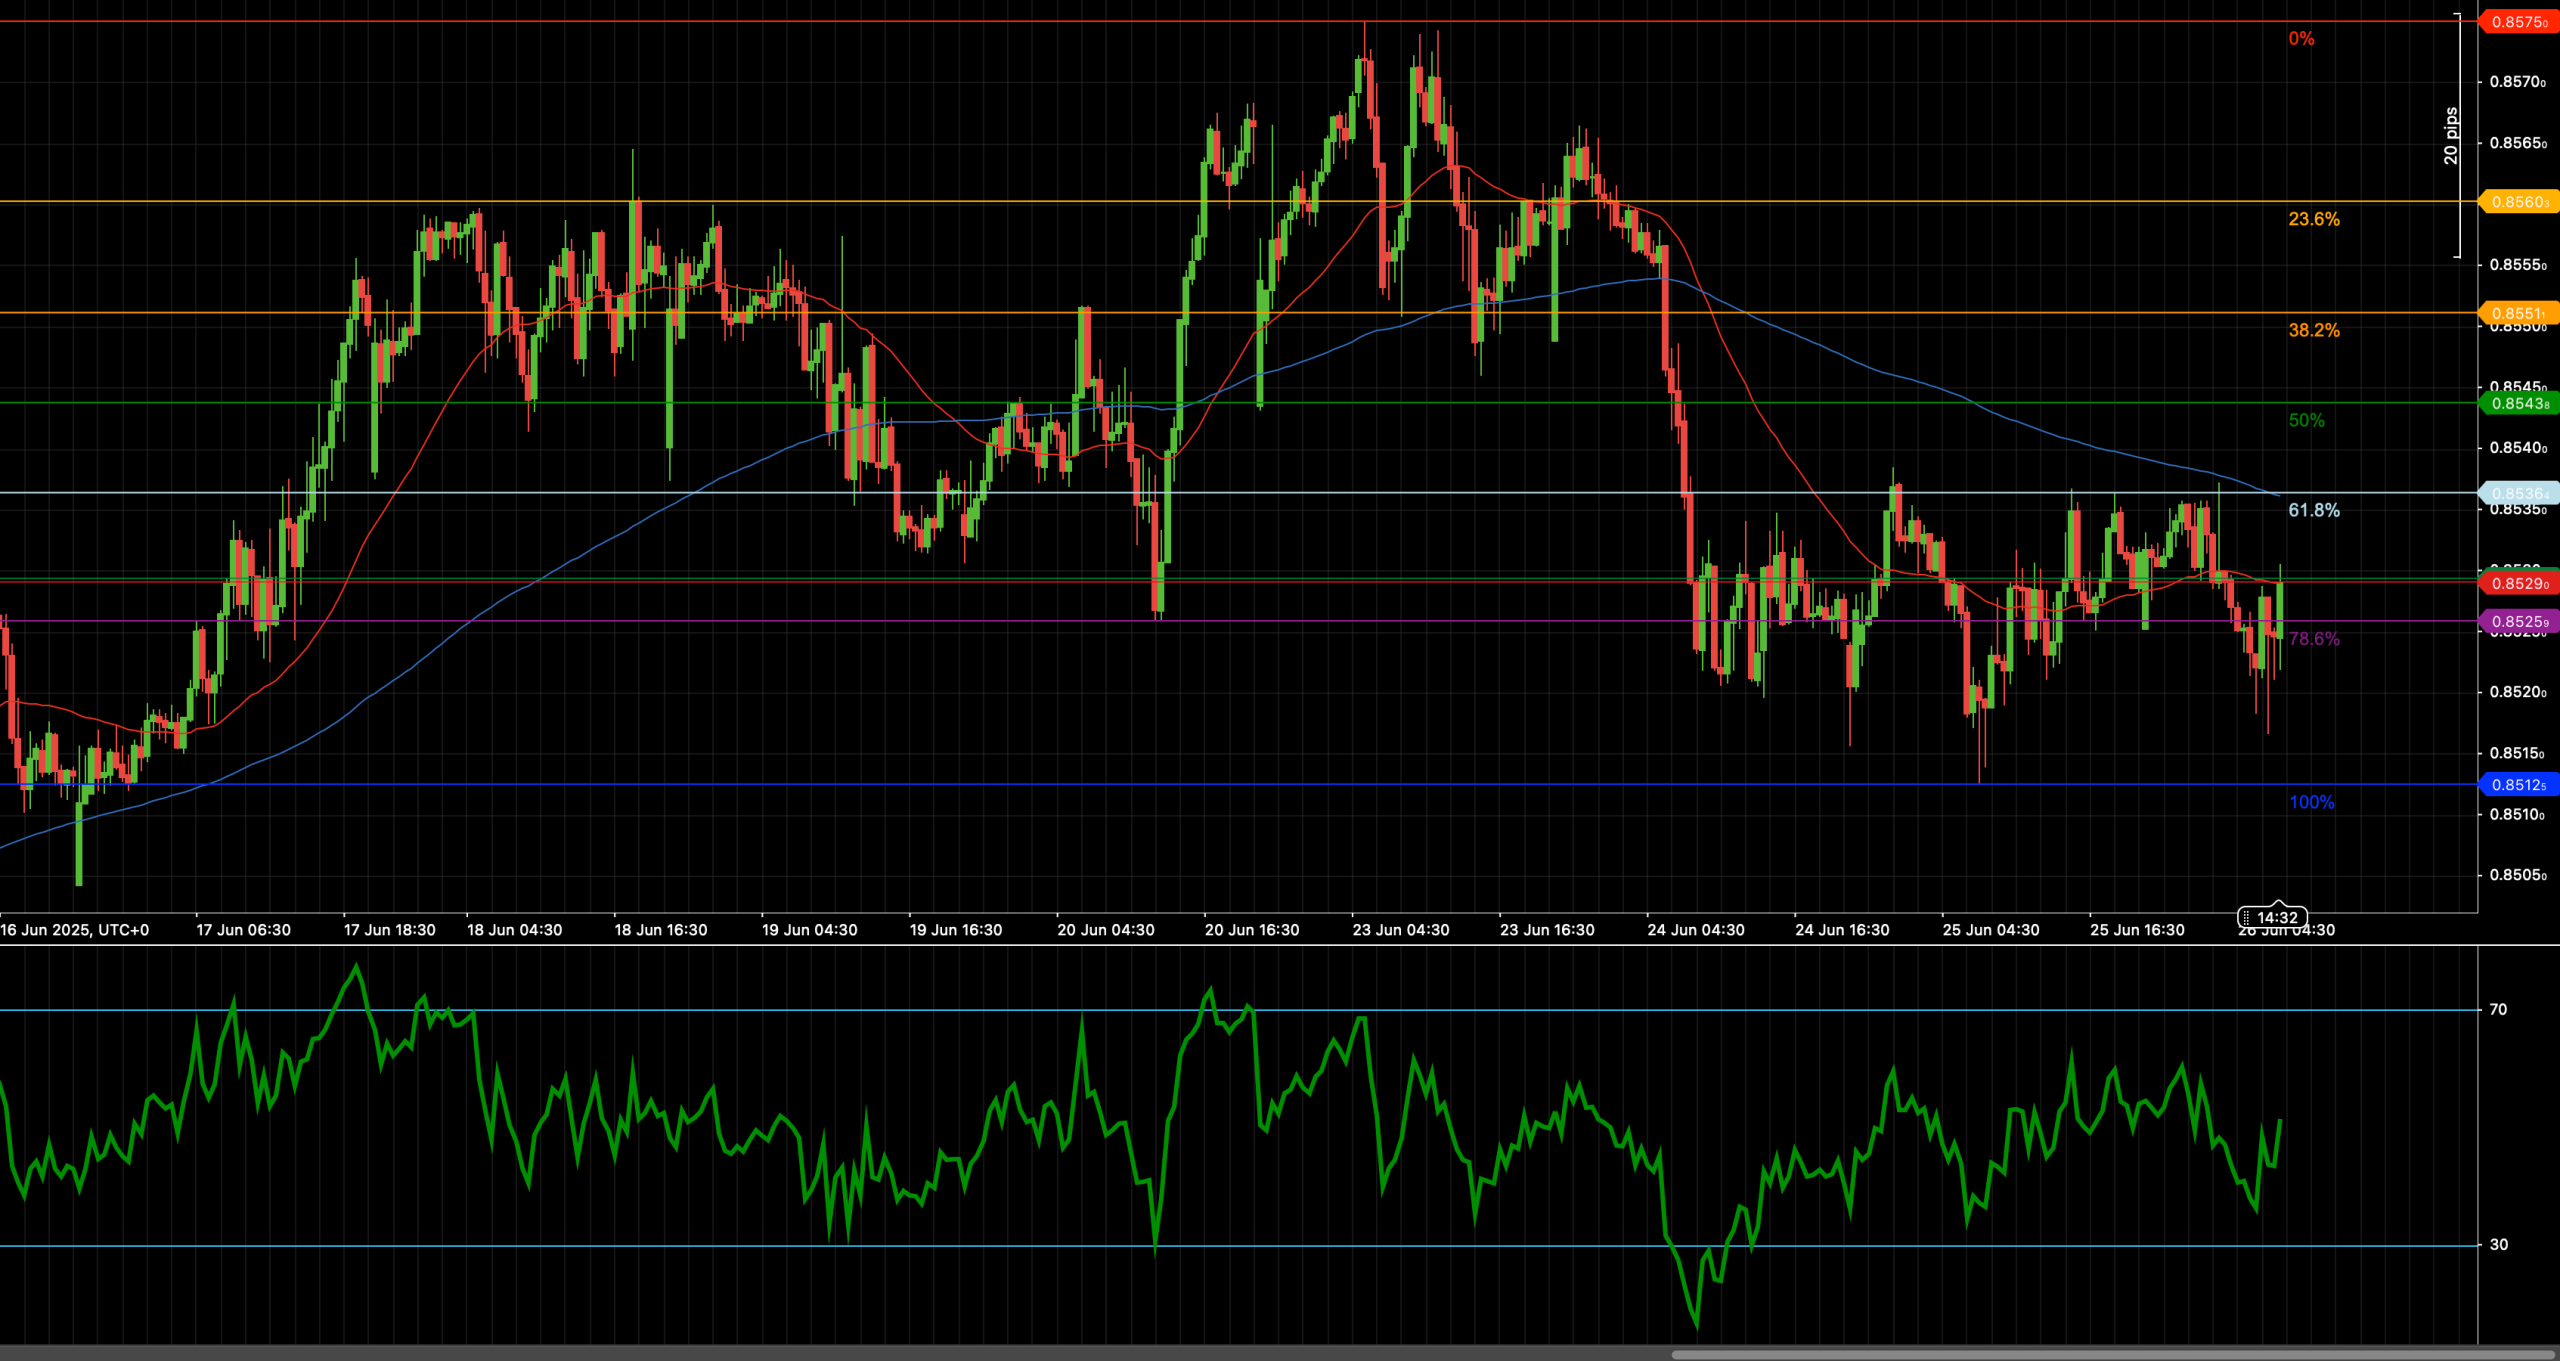
The 78.6% Fibonacci retracement at 0.8520 is the primary support level and has successfully cushioned several pullbacks over recent sessions. Should this zone fail, the 100% retracement level at 0.8512 comes into play as the final structural line of defense before exposing deeper support near 0.8485. On the upside, immediate resistance rests at 0.8540, which has capped all recent rebounds. A breakout above this pivot could ignite a move toward 0.8555 and 0.8580, corresponding to the 50% and 38.2% retracements of the latest down leg.
Moving Averages and Dynamic Price Action
EUR/GBP remains structurally soft as price holds beneath both the 50- and 200-period weighted moving averages. These moving averages are beginning to converge around 0.8535, creating a ceiling that aligns closely with the aforementioned resistance level. The flat slope of the 200-WMA suggests lack of trend conviction, while the 50-WMA points modestly downward, reflecting pressure. For bullish sentiment to take hold, the pair must close decisively above this moving average cluster, validating a structural rotation.
RSI Momentum and Bearish Tilt
The 14-period RSI is hovering close to the 50 mark, reinforcing the idea of neutral momentum. Recent failures to break above 55 have coincided with rejection candles near resistance, while dips below 45 have quickly reversed. This tight RSI behavior suggests a market waiting on a catalyst. A clear RSI break above 60 or below 40 will likely provide confirmation of breakout direction, adding credibility to price structure signals.
Candlestick Behavior and Price Action Clarity
The candlestick sequence highlights indecision, with multiple doji-like patterns and shallow wicks indicating a lack of aggressive buying or selling. Despite several tests of both extremes of the consolidation band, follow-through has remained weak. A wide-bodied candle closing outside of 0.8540 or beneath 0.8512 would change this landscape and signal a directional shift. Until then, traders should treat these levels as range borders.
Chart Structure and Neutral Bias Formation
The current price structure resembles a sideways coil — a neutral base after a pullback — rather than a clear continuation or reversal setup. This zone could evolve into a larger reversal structure if price lifts above resistance with volume, or continue lower if bearish pressure reemerges. For now, range trading bias prevails, with the pair grinding out a potential base formation. Only a confirmed higher low followed by breakout above 0.8540 would confirm a transition into bullish territory.
Fibonacci Retracement and Extension Levels
The Fibonacci grid from the 0.8575 high to the 0.8512 low frames the current technical landscape. Price is interacting with the 78.6% level at 0.8520, making it a high-probability zone for range-bound reaction. A breakdown would fully complete the retracement toward 0.8512 and could extend to 0.8490 and 0.8470. On the upside, recovering 0.8540 reopens the door to 0.8555 (50% Fib) and 0.8580 (38.2% Fib), where meaningful structure and moving average barriers await.
🔍 MARKET OUTLOOK & TRADING SCENARIOS
Bullish Scenario
A strong break above 0.8540 with RSI climbing through 60 would signal a bullish reversal pattern. This setup could target 0.8555 and possibly 0.8580. Sustained trade above the 200-WMA would further validate momentum. Bulls should watch for impulsive candles supported by volume.
Neutral Scenario
The pair may continue to oscillate between 0.8512 and 0.8540, offering low-volatility mean-reversion setups. In this case, RSI would likely remain between 45 and 55. Until a decisive breakout emerges, range strategies will remain in favor.
Bearish Scenario
A daily close below 0.8512 with RSI slipping toward 40 or lower would trigger fresh downside targets. Initial focus would shift to 0.8490, with deeper follow-through possibly reaching 0.8470. This would confirm resumption of the broader decline from 0.8575.
💼 TRADING CONSIDERATIONS
- Bullish setup: Buy breakout above 0.8540 with targets at 0.8555 and 0.8580; stop below 0.8512
- Bearish setup: Sell breakdown below 0.8512 targeting 0.8490 and 0.8470; stop above 0.8540
- In range conditions, consider fade strategies near 0.8515–0.8540 boundaries with tight stops and RSI confirmation
🏁 CONCLUSION
EUR/GBP is consolidating tightly near the 78.6% Fibonacci level at 0.8520, caught between neutral momentum and hesitant structure. With moving averages overhead and no decisive RSI tilt, the cross remains locked in a technical grid. Traders should monitor for breakout confirmation at either 0.8540 or 0.8512 to gauge the next major move. Until that unfolds, this remains a trader’s range with limited directional edge.
⚠️ DISCLAIMER
This analysis is for informational purposes only and does not constitute financial advice. Always consult with a licensed financial professional before making trading decisions.


