
📊 MARKET OVERVIEW
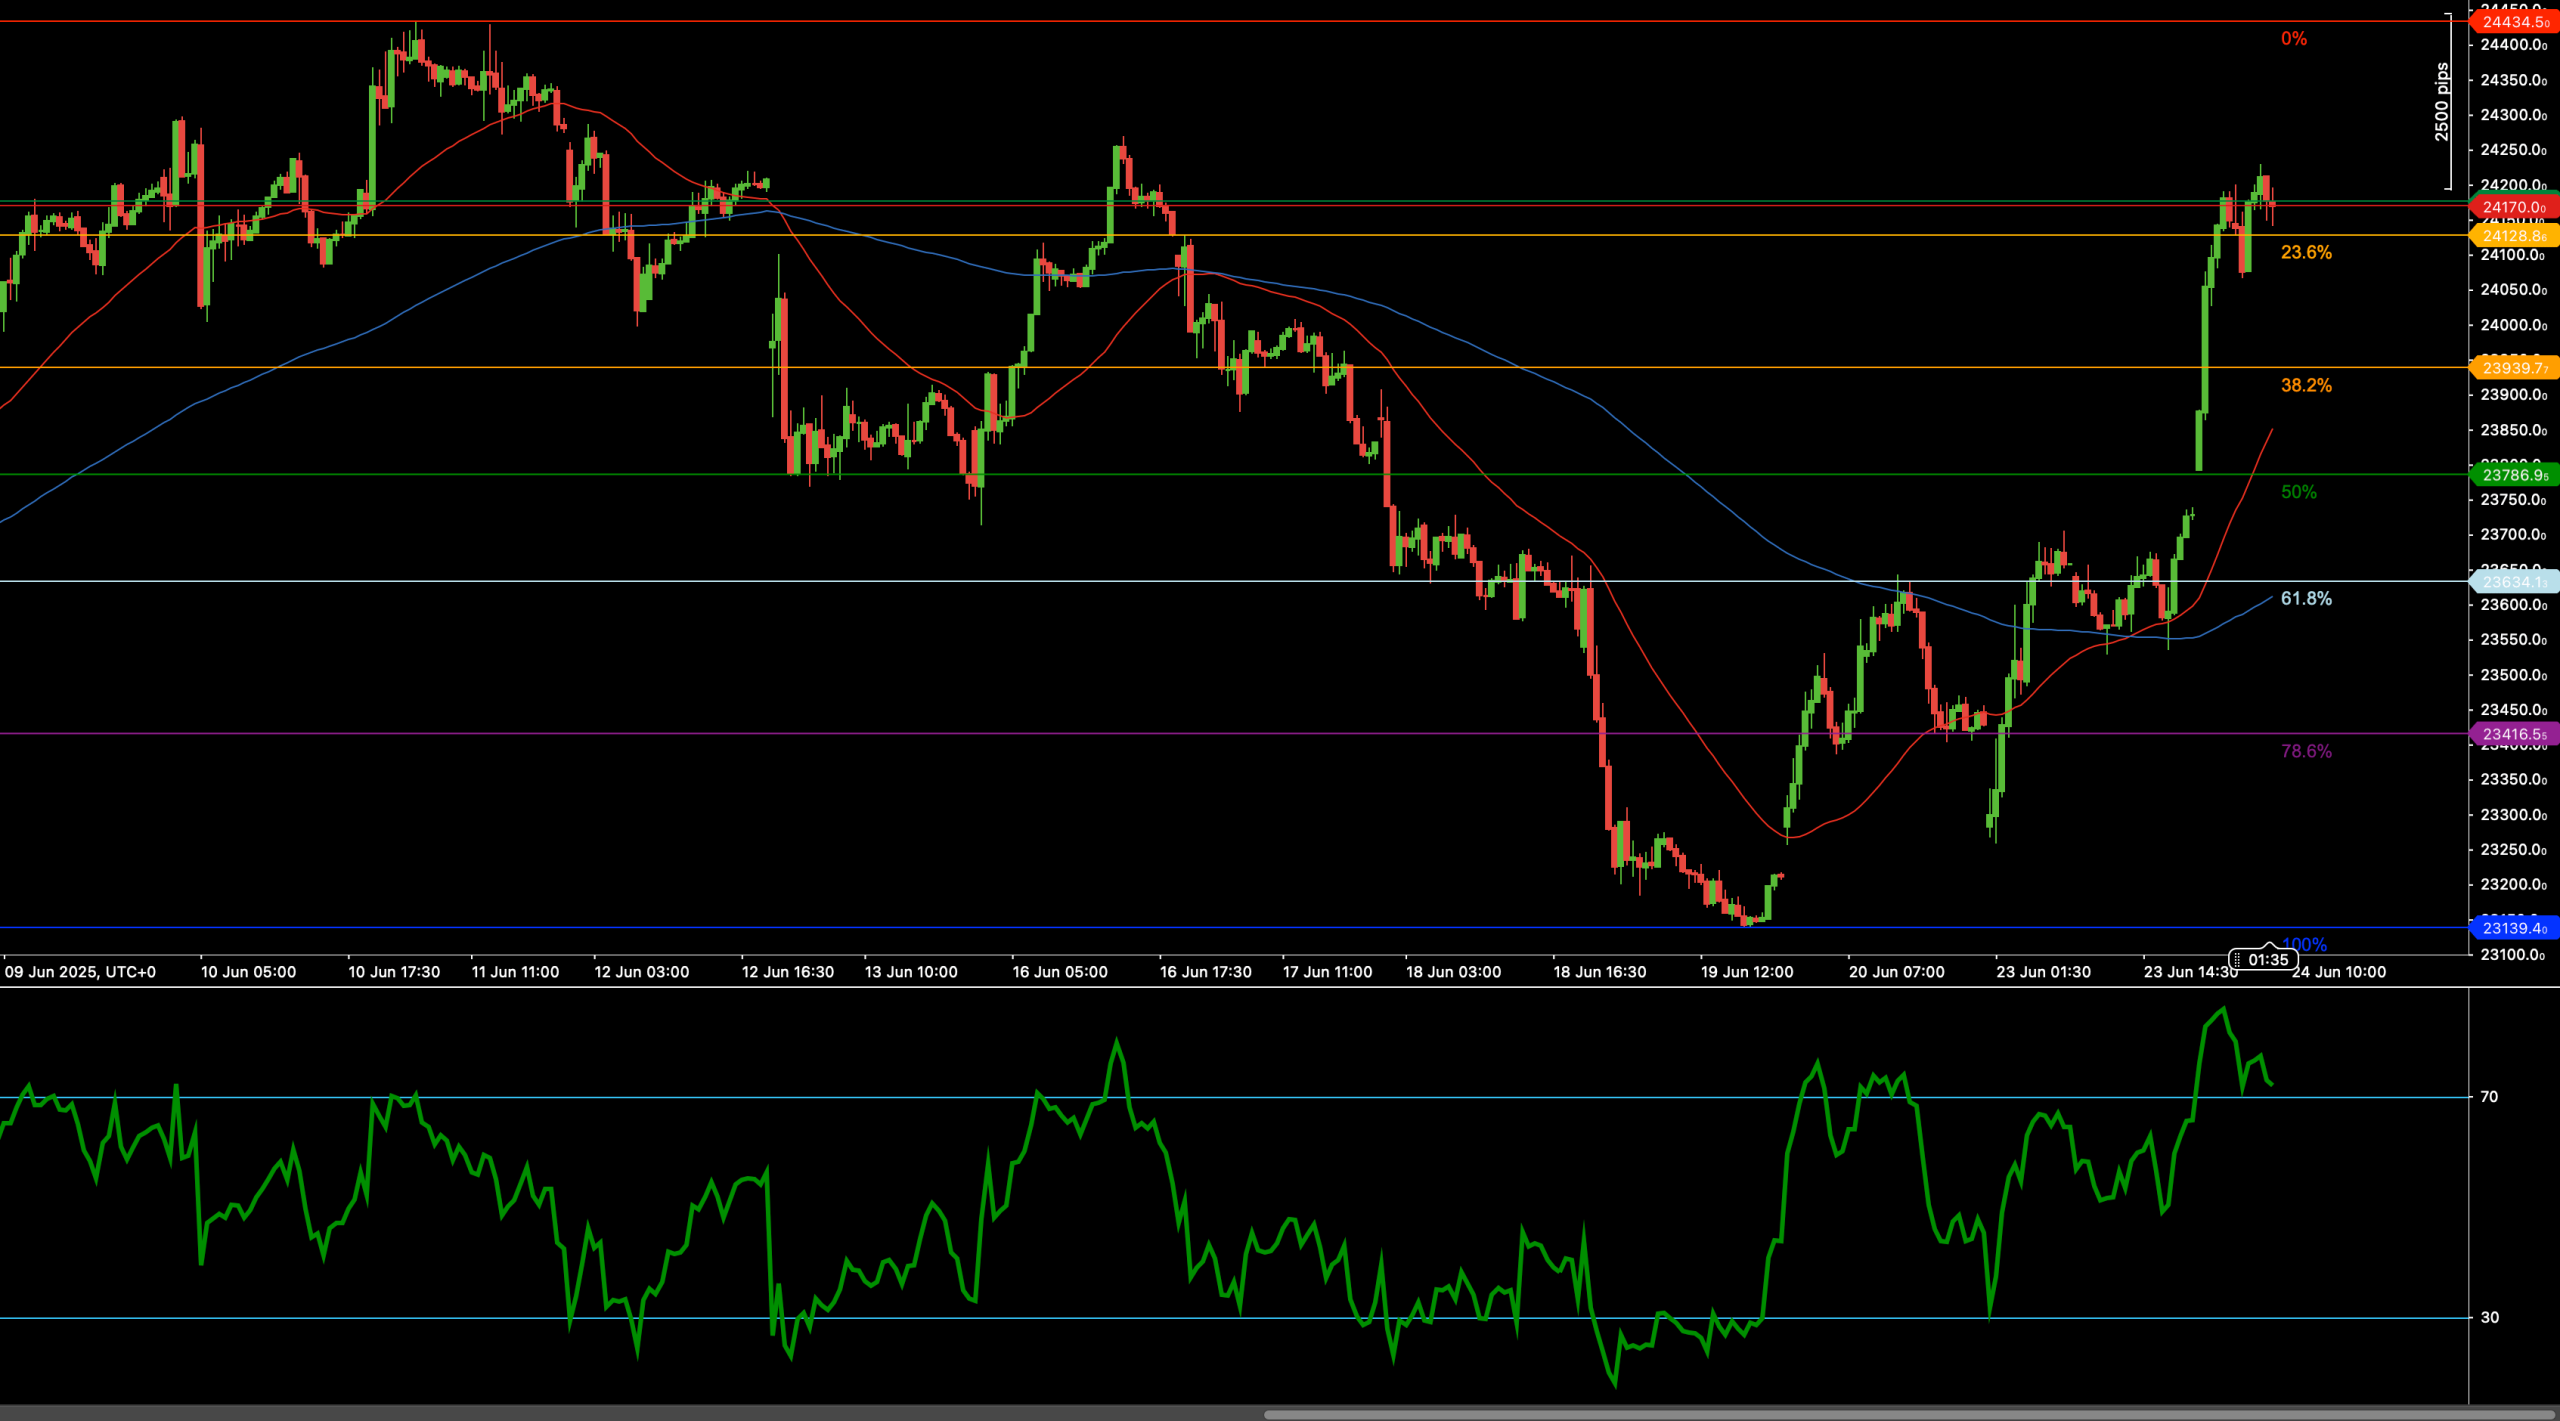
HSI50 has staged an impressive rebound after reaching lows near 23,139, with the index now testing the key 23.6% Fibonacci retracement at 24,170. The rally has been aggressive, with momentum surging in the past several sessions. Price is now trading well above both the 50-period and 200-period weighted moving averages, marking a notable shift in near-term trend dynamics.
The 14-period RSI has risen sharply toward overbought levels, suggesting that momentum remains strong — but also that caution is warranted as the index tests initial resistance. Whether buyers can sustain this pace or whether profit-taking emerges around the 24,170 zone will likely determine the next directional move.
📈 TECHNICAL ANALYSIS
Key Support and Resistance Levels
Immediate resistance is now being tested at 24,170 (23.6% Fib). A confirmed breakout above this level would expose further upside toward 24,346 (swing high / 0%).
Support zones below are found at 23,930 (38.2%), followed by 23,775 (50%) and 23,545 (61.8%). As long as price holds above these levels, the current bullish bias remains intact.
Moving Averages and Dynamic Price Action
Price has decisively broken above both the 50-period and 200-period weighted moving averages, which now act as dynamic support zones. The 50-WMA is sloping higher, confirming renewed bullish momentum, while the 200-WMAhas flattened after previously trending lower.
As long as HSI50 remains above this moving average cluster, pullbacks are likely to be shallow, offering potential buying opportunities on dips.
RSI Momentum and Bullish Impulse
The 14-period RSI has surged above 70, reaching into overbought territory as the rally tests resistance. This signals strong bullish momentum — but also warns of possible exhaustion in the short term if buyers fail to clear resistance decisively.
A sustained RSI hold above 65–70 would favor continued upside. However, if RSI rolls lower from current levels, a corrective pullback toward the moving averages is likely.
Candlestick Behavior and Price Action Clarity
Recent candlesticks reflect strong bullish commitment, with large-bodied candles and minimal lower wicks. However, smaller candle bodies appearing near 24,170 suggest that initial selling interest may be building as bulls confront key resistance.
A strong breakout candle through 24,170 would confirm renewed upside potential. Conversely, rejection at this level could see price drift lower toward support.
Chart Structure and Breakout Formation
Structurally, HSI50 is forming a textbook V-shaped reversal, having reclaimed key moving averages and erased a significant portion of the prior downtrend. The rally now faces its first major resistance test — whether this leads to consolidation, continuation, or rejection will define the near-term outlook.
As long as price holds above 23,775, the bullish structure remains in place.
Fibonacci Retracement and Extension Levels
The Fibonacci retracement grid from 24,346 (swing high) to 23,139 (swing low) outlines the key levels in play. Price is currently testing 23.6% at 24,170, with next targets toward 24,346 on a confirmed breakout.
Should the index fail at resistance, pullback targets include 23,930 (38.2%) and 23,775 (50%), where buyers may look to reload.
🔍 MARKET OUTLOOK & TRADING SCENARIOS
Bullish Scenario
A clean breakout above 24,170, with RSI remaining elevated, could drive HSI50 toward 24,346. As long as pullbacks remain shallow and above the moving averages, bullish bias is favored.
Neutral Scenario
Failure to break 24,170 and RSI flattening below 70 may trigger a consolidation range between 23,930–24,170. This would represent healthy digestion after the sharp rally.
Bearish Scenario
A clear rejection from 24,170, combined with RSI falling below 65, could open the path for a pullback toward 23,775–23,545. A move below these levels would weaken the bullish outlook.
💼 TRADING CONSIDERATIONS
Bullish setup: Look for breakout signals above 24,170, with RSI holding above 65. Targets: 24,346. Stops below 23,930.
Bearish setup: Short setups may emerge on confirmed rejection of 24,170. Targets: 23,930–23,775. Stops above 24,170.
Risk context: RSI overbought, so traders should watch for signs of exhaustion or continuation at current levels.
🏁 CONCLUSION
HSI50 has staged a sharp rebound and is now testing 23.6% Fibonacci resistance at 24,170. While momentum remains strong and moving averages are supportive, RSI near overbought warns of possible short-term consolidation or pullback. The next sessions will be pivotal — a breakout could target 24,346, while failure may bring corrective action toward lower supports.
⚠️ DISCLAIMER
This analysis is for informational purposes only and does not constitute financial advice. Always consult with a licensed financial professional before making trading decisions.


