
📊 MARKET OVERVIEW
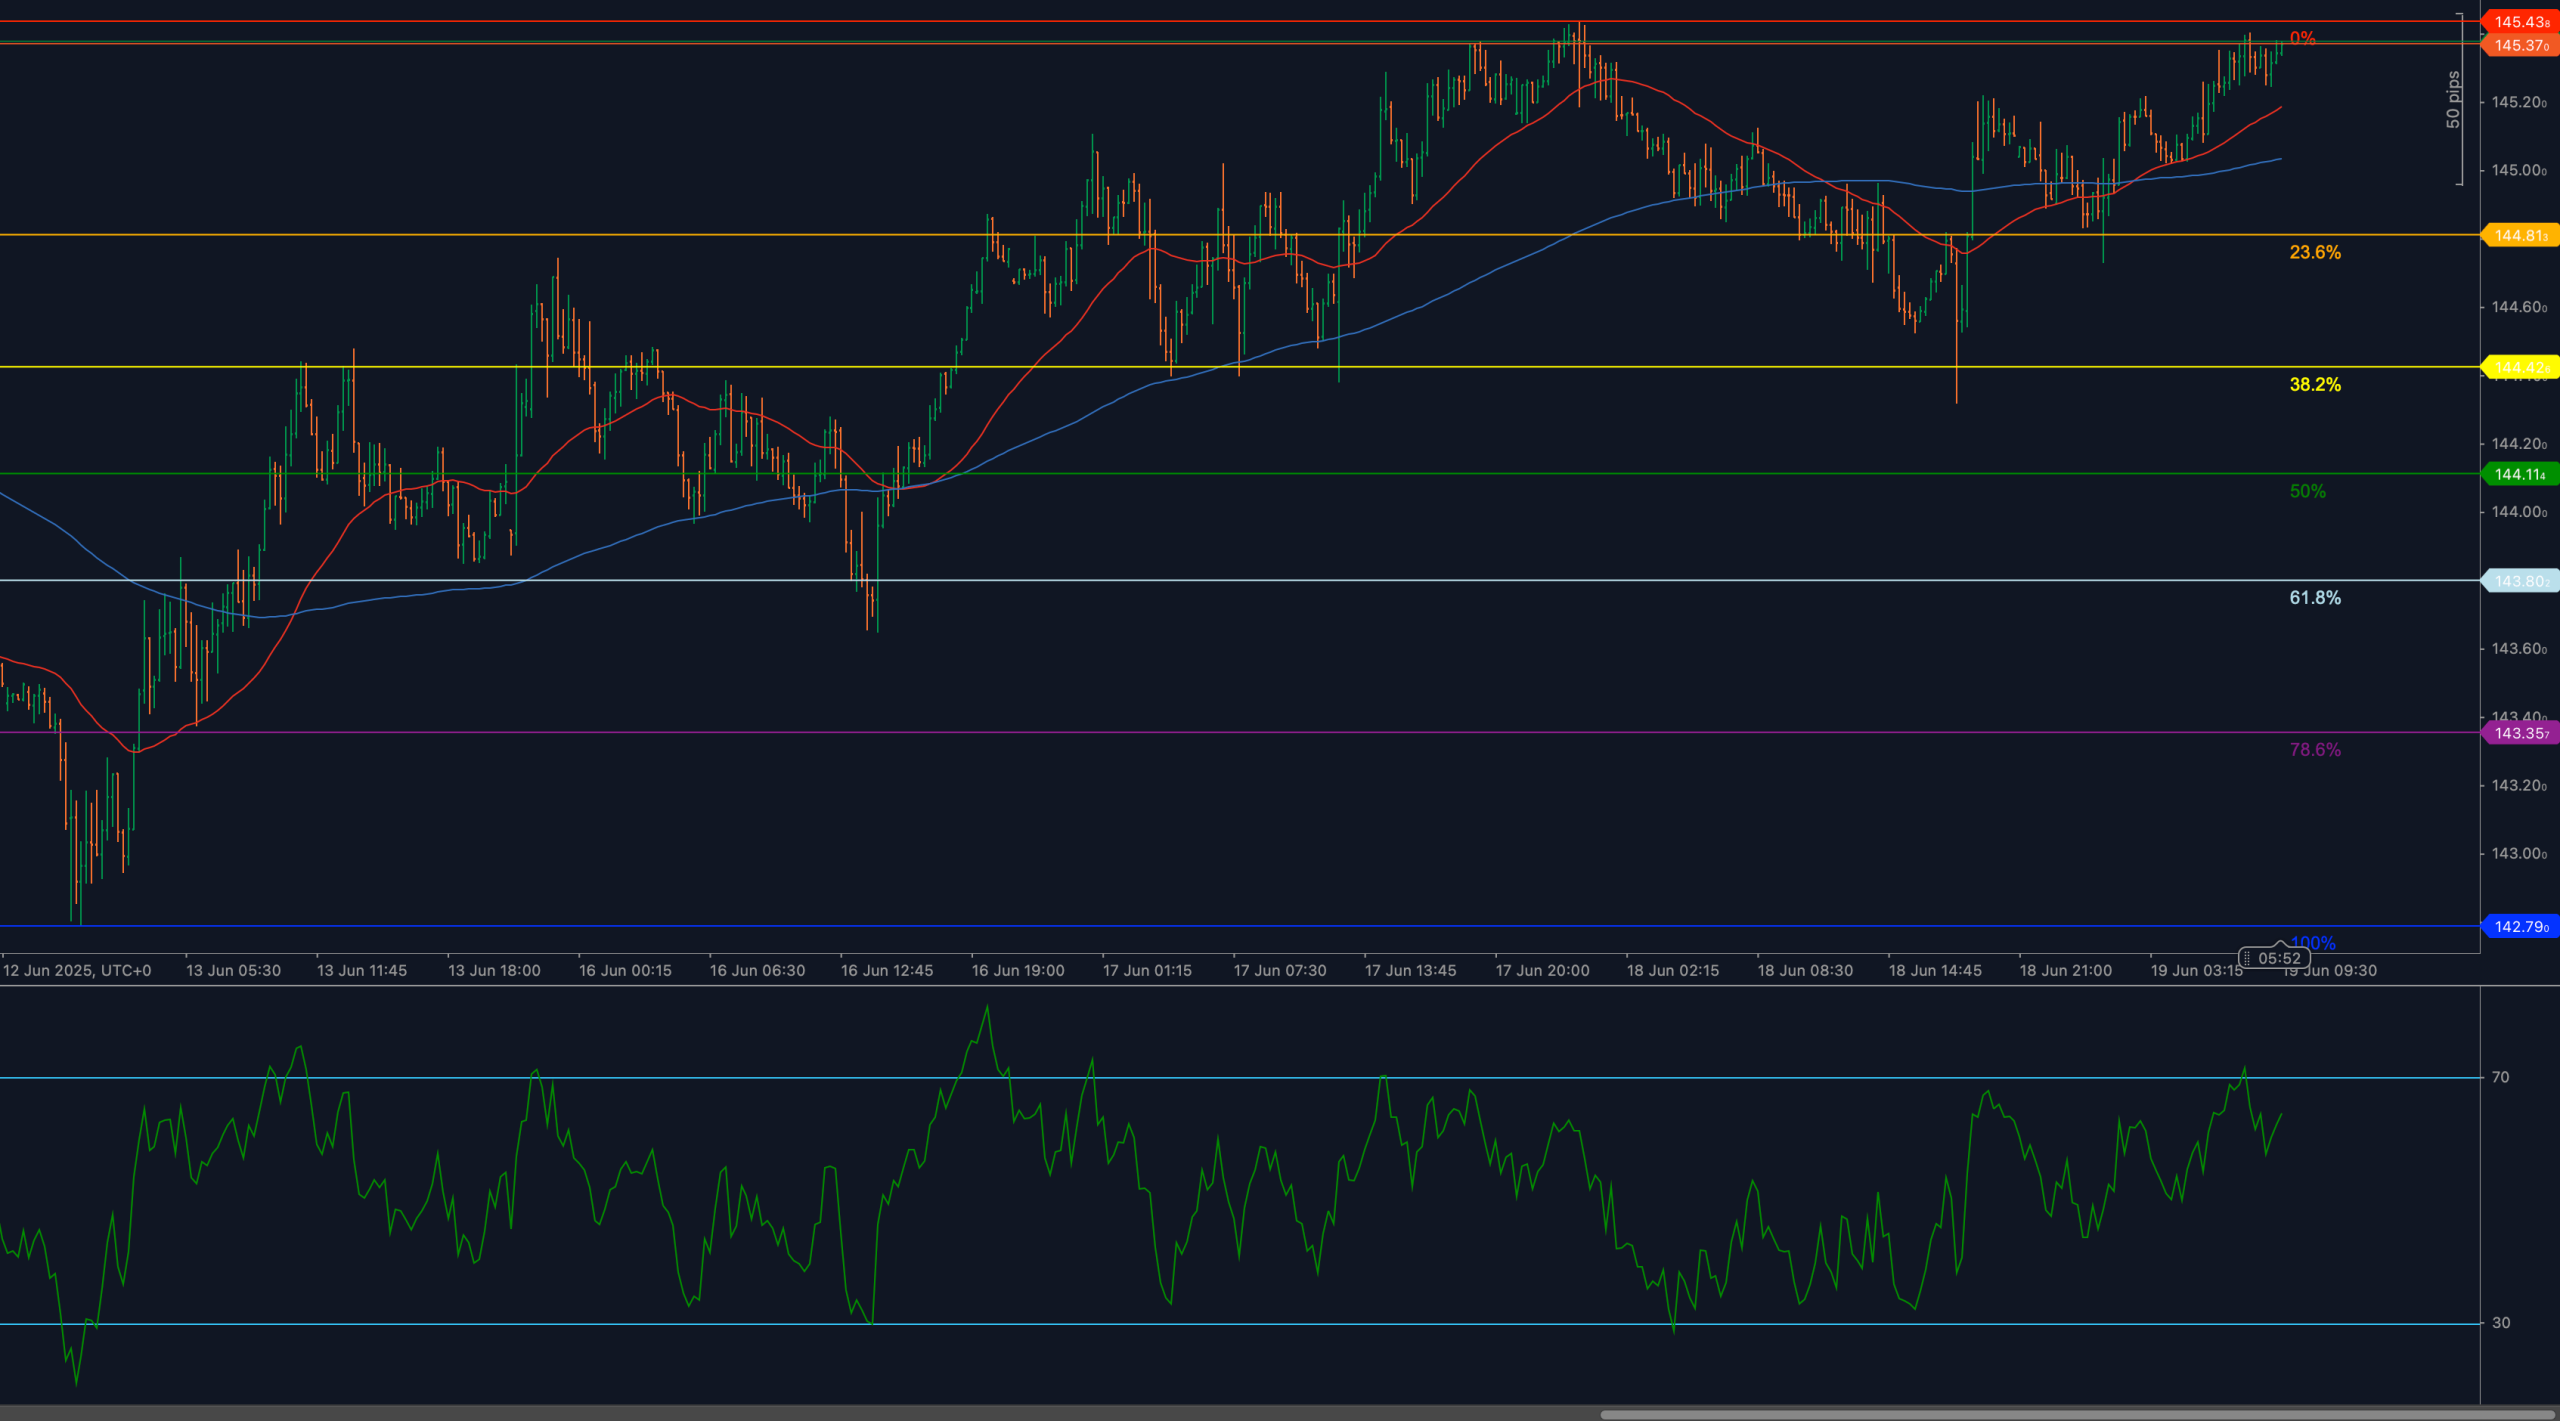
USD/JPY remains in a well-defined bullish phase, having advanced strongly from the recent low near 142.79 to test the critical 145.43 resistance zone. The pair has steadily reclaimed higher ground, with price pushing decisively above both the 50-period and 200-period weighted moving averages, confirming a clear shift in momentum and near-term trend dynamics. The structure now favors the bulls, but the proximity to key resistance coupled with a rising RSI reading near overbought levels signals that the rally may be entering a pause phase.
This surge has been supported by persistent U.S. dollar strength and rising yield differentials, which continue to drive demand for USD/JPY. However, as price approaches multi-session highs and key Fibonacci resistance, traders are likely to reassess risk. Without a sustained breakout above 145.43, the pair could enter a period of consolidation or minor correction, especially if RSI momentum begins to fade.
📈 TECHNICAL ANALYSIS
Key Support and Resistance Levels
Immediate resistance sits at 145.43, the prior swing high and psychological barrier. A confirmed breakout above this level would clear the way toward higher targets above 145.80 and potentially into the 146.00+ range. However, rejection at this level could open the door for corrective flows.
To the downside, initial support rests at 144.81 (23.6% Fib retracement), followed by deeper technical supports at 144.42 (38.2%) and 144.11 (50%). Should bearish momentum build, a pullback toward 143.80 (61.8%) could emerge as a key test of structural integrity. These levels will be critical in determining whether buyers retain control or whether a larger correction develops.
Moving Averages and Dynamic Price Action
Price remains well supported by the 50-period and 200-period weighted moving averages, both of which are trending positively and providing a constructive bias. The 50-WMA has accelerated upward, while the 200-WMA is flattening but still acting as dynamic support. Current positioning suggests that the broader trend remains bullish as long as price holds above the 144.40–144.50 cluster.
A break below these averages would signal a potential short-term trend shift, but as long as they hold, pullbacks are likely to be shallow and corrective, offering potential re-entry points for trend-following buyers.
RSI Momentum and Bullish Impulse
The 14-period RSI is approaching overbought territory near the 68–70 zone, reflecting the strength of the recent rally. However, the pace of RSI gains has begun to flatten, indicating that buying momentum may be peaking as the pair tests overhead resistance. This dynamic increases the likelihood of consolidation or corrective price action unless bulls can push RSI cleanly above 70 with strong price follow-through.
Should RSI turn lower from current levels and slip below 60, it would likely confirm the onset of a pullback toward lower support areas. Conversely, a renewed RSI surge would validate continued bullish extension toward fresh highs.
Candlestick Behavior and Price Action Clarity
Recent candles show smaller bullish bodies as price grinds toward 145.43, with some upper wicks emerging — signs of waning upside momentum and growing hesitation among buyers. No outright reversal patterns are yet present, but the lack of impulsive breakout candles reinforces the notion of potential stalling at current levels.
Traders should remain vigilant for the emergence of reversal formations such as bearish engulfing candles or pin bars, which could further confirm exhaustion near resistance. Conversely, a decisive bullish close above 145.43 would reinvigorate bullish sentiment and likely trigger stop-driven buying.
Chart Structure and Breakout Formation
Structurally, the pair remains in a classic bullish continuation pattern, with a clear sequence of higher highs and higher lows in place. The current test of 145.43 represents a pivotal moment — either the rally extends with a confirmed breakout or price retreats to retest lower Fibonacci supports and moving average zones.
As long as the pair remains above 144.42, the underlying bullish structure is intact. A deeper move below 143.80, however, would begin to erode this constructive setup and suggest a more significant correction may be underway.
Fibonacci Retracement and Extension Levels
The Fibonacci retracement grid from the 142.79 low to the 145.43 high outlines key levels that are likely to shape the next phases of price action. Initial support resides at 144.81 (23.6%), with more significant levels at 144.42 (38.2%)and 144.11 (50%). A deeper retracement into 143.80 (61.8%) would represent a more aggressive correction, but would not necessarily invalidate the larger uptrend unless accompanied by a structural breakdown.
Overall, unless price fails to hold above 144.11, the technical roadmap remains supportive of higher prices once the current pause is resolved.
🔍 MARKET OUTLOOK & TRADING SCENARIOS
Bullish Scenario
If USD/JPY breaks cleanly above 145.43 with expanding RSI momentum and strong volume, the path would open toward fresh highs, targeting 145.80 and beyond. As long as the pair holds above the moving averages and RSI remains elevated, dips are likely to be viewed as buying opportunities.
Neutral Scenario
A failure to break resistance at 145.43 could lead to sideways consolidation between 144.81–145.43. This range would reflect market indecision, with traders awaiting new catalysts. RSI flattening between 60–65 would reinforce a neutral bias and encourage tactical range trading.
Bearish Scenario
A clear rejection from 145.43, coupled with RSI turning lower below 60, could trigger a pullback toward the 144.42–144.11 support zone. A break below 143.80 would shift bias to bearish and potentially expose deeper downside targets.
💼 TRADING CONSIDERATIONS
Bullish setup: Consider long entries on a confirmed breakout above 145.43, targeting 145.80–146.00, with protective stops below 144.81 to manage risk.
Bearish setup: Short setups may emerge on a confirmed rejection of 145.43 or a break below 144.42, targeting 144.11–143.80, with stops placed above 145.43.
Risk context: With RSI near overbought and price testing key resistance, traders should be prepared for potential volatility and sharp reactions around current levels.
🏁 CONCLUSION
USD/JPY remains in a strong bullish trend but is now facing critical resistance at 145.43. RSI momentum is elevated, and buying interest remains solid, but without a clear breakout, the risk of consolidation or pullback is increasing. The pair remains technically constructive as long as it holds above the 144.42–144.11 support band. Traders should monitor price behavior closely at 145.43 to gauge whether the current rally will extend or pause for correction.
⚠️ DISCLAIMER
This analysis is for informational purposes only and does not constitute financial advice. Always consult with a licensed financial professional before making trading decisions.


