
📊 MARKET OVERVIEW
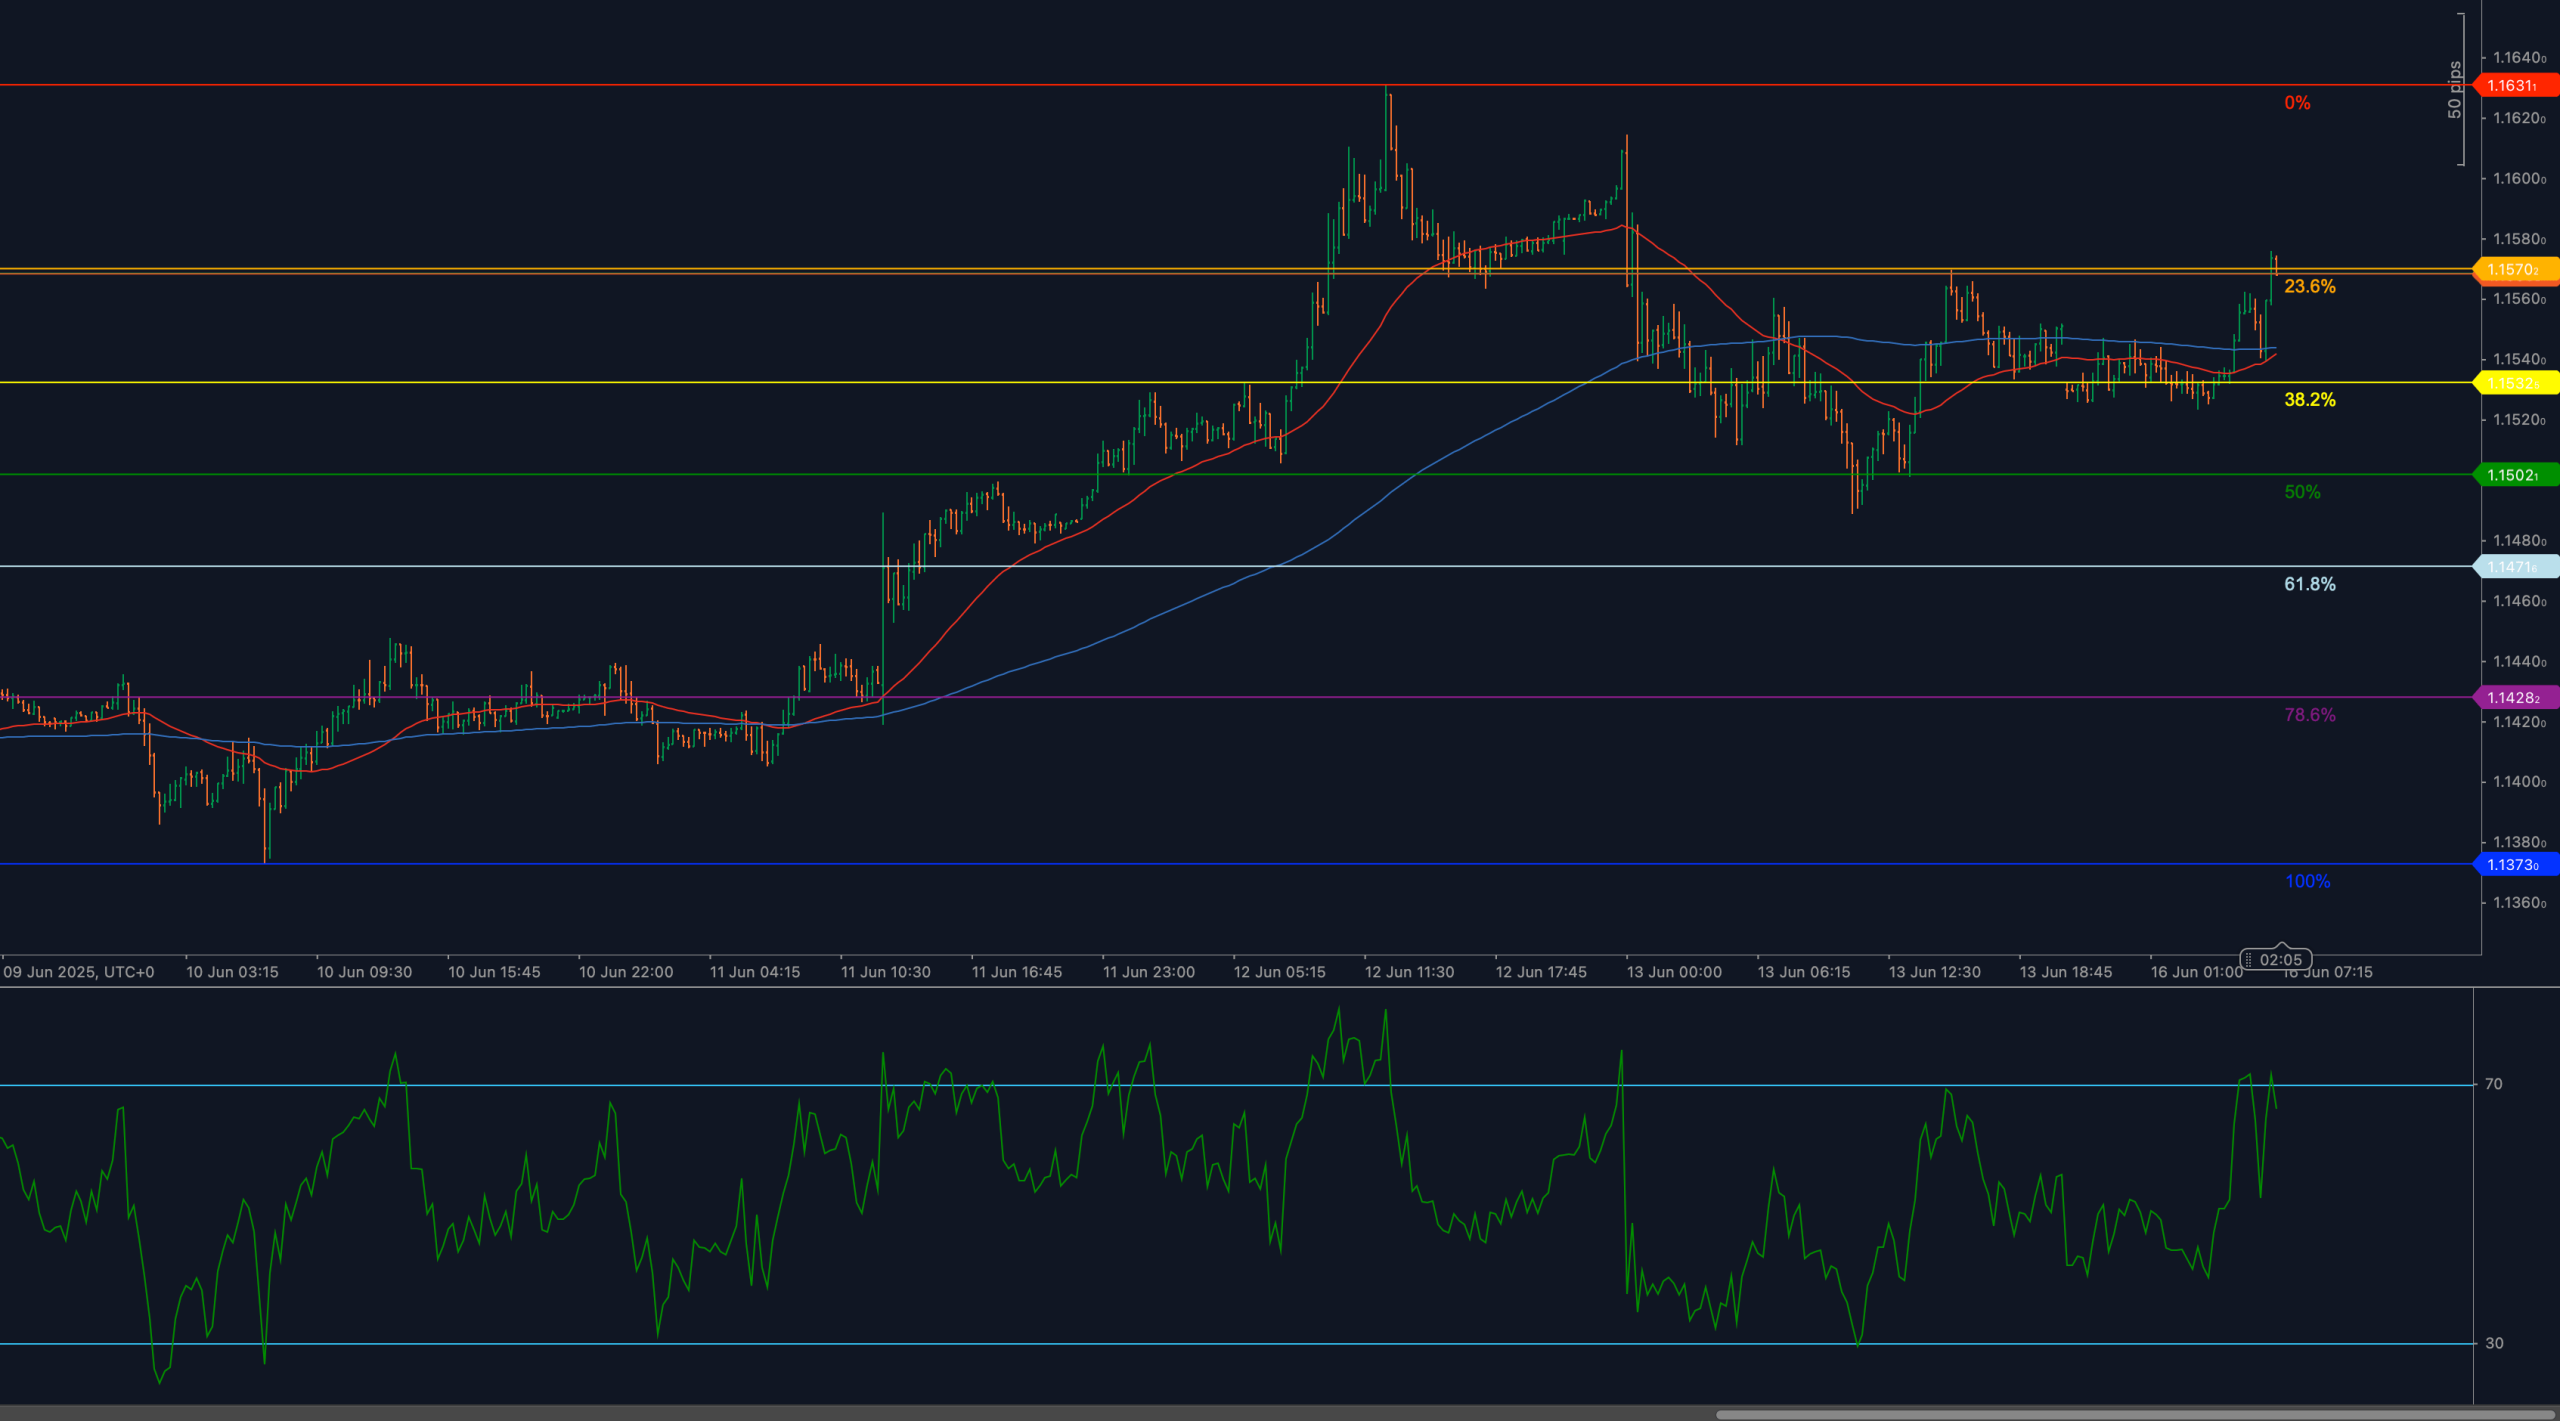
EUR/USD has advanced toward the 1.1570 barrier following a well-supported breakout from the 1.1502–1.1520 consolidation band. This move comes on the back of a bullish recovery leg that began after the pair carved out a swing low at 1.1373, establishing a base and initiating higher highs. The recent rally has driven the pair above its key moving averages, reflecting increasing directional strength and a shift in short-term sentiment. Price is now interacting with the 23.6% Fibonacci retracement from the 1.1631–1.1373 range, signaling a pause zone where bulls may reassess before the next breakout attempt.
This advance is supported by improving economic expectations and softening U.S. yield pressure, which has weakened the dollar index in recent sessions. Unless the pair fails sharply at current levels, momentum suggests EUR/USD could maintain its upside posture through the coming sessions, provided RSI and structural supports remain intact.
📈 TECHNICAL ANALYSIS
Key Support and Resistance Levels
Resistance now sits at 1.1570, aligning with the 23.6% Fibonacci retracement of the recent decline from 1.1631. A breakout above this level could trigger a retest of 1.1600 and possibly the full retracement at 1.1631. To the downside, immediate support lies at 1.1520 (recent breakout pivot), followed by 1.1502 and the 38.2% retracement at 1.1502. Deeper supports appear at 1.1470 and the midpoint 1.1428, which also marked the 78.6% retracement zone of the June advance.
Moving Averages and Dynamic Price Action
EUR/USD has reclaimed both the 50-period and 200-period weighted moving averages, with the 50-WMA now beginning to turn upward. The recent bullish crossover enhances structural strength and marks a clear departure from prior consolidation. These moving averages now cluster near the 1.1520–1.1540 zone and serve as dynamic support. So long as the pair remains above this band, pullbacks are expected to be shallow and corrective.
RSI Momentum and Bullish Impulse
The 14-period RSI has climbed firmly toward the 70 threshold, confirming bullish momentum and a clean upward acceleration. Momentum is strengthening without signs of bearish divergence. If RSI remains above 60, buyers are likely to dominate short-term action. A dip below 50 would indicate exhaustion, but for now, momentum conditions favor trend continuation.
Candlestick Behavior and Price Action Clarity
Recent candles show wide bullish bodies with limited upper wicks, indicating strong follow-through from buyers. The breakout above 1.1520 was confirmed by back-to-back impulsive candles, and no reversal formations are yet present near resistance. However, watch for long upper wicks or bearish engulfing setups around 1.1570 — any rejection here may shift the short-term bias.
Chart Structure and Breakout Formation
The pair has now exited a multi-session consolidation band and is forming a new breakout leg. Higher highs and higher lows are clearly visible, with each impulsive leg exceeding the last. The move from 1.1373 to 1.1570 forms a clean bullish channel, and unless price collapses back below the breakout zone, structure supports further extension. This upward momentum is textbook continuation — not mean reversion — and reflects a well-anchored trend.
Fibonacci Retracement and Extension Levels
The Fibonacci retracement from the 1.1373 swing low to the 1.1631 swing high reveals key technical zones. The pair has now cleared the 38.2% level at 1.1502 and is testing the 23.6% retracement at 1.1570. A sustained break above this level could open the path to 1.1600 and eventually a full retracement to 1.1631. On the downside, failure to hold above 1.1520 may reintroduce bearish pressure and target 1.1502, 1.1470, or deeper into 1.1428 and 1.1373. Current Fibonacci structure favors bullish continuation unless support zones are violated.
🔍 MARKET OUTLOOK & TRADING SCENARIOS
Bullish Scenario
If EUR/USD holds above 1.1520 and RSI sustains above 60, the pair is likely to push through 1.1570 and extend toward 1.1600–1.1631. Momentum pullbacks toward moving average support may offer reentry zones for continuation trades.
Neutral Scenario
A stall beneath 1.1570, combined with RSI flattening around 55–60, may trigger short-term sideways range development between 1.1520–1.1570. Traders could expect a flag pattern or narrow consolidation before the next directional impulse.
Bearish Scenario
Should the pair drop below 1.1520 with RSI breaking under 50, a pullback toward 1.1502 or deeper into the 1.1470–1.1428 range becomes possible. A daily close below 1.1428 would shift structure decisively toward bearish reversal.
💼 TRADING CONSIDERATIONS
EUR/USD shows a clean breakout structure above key moving averages and Fibonacci zones. Bias favors buying dips above 1.1520 with targets toward 1.1600 and 1.1631. Bears must wait for confirmed rejections or reversal candles near resistance to reestablish control. Until then, momentum and structure remain bullish.
🏁 CONCLUSION
EUR/USD continues to climb, supported by strong momentum and bullish structure, with RSI testing overbought territory. As long as the pair holds above 1.1520 and sustains buying interest, further upside toward 1.1600–1.1631 remains in play. Key levels to watch include 1.1570 as breakout resistance and 1.1520 as structural support.
⚠️ DISCLAIMER
This analysis is for informational purposes only and does not constitute financial advice. Always consult with a licensed financial professional before making trading decisions.


