
📊 MARKET OVERVIEW
ESP35 is entering a short-term consolidation phase following its recent bullish leg that pushed the index to a new local high at 14285.2. While the uptrend remains intact, momentum has slowed noticeably. Price has stalled just beneath the 0% Fibonacci projection, and the 23.6% retracement level at 14229.5 is now acting as immediate support. The market appears to be digesting recent gains while awaiting the next directional impulse. Buyers continue to defend near-term support, but bearish signals are beginning to build.
The broader trend remains bullish, as price action continues to trade above both the 50-period and 200-period weighted moving averages. However, RSI has rolled over and is trending lower from recent highs, indicating a loss of momentum. This divergence between price and oscillator warrants caution for traders looking to extend long positions. Unless bulls reclaim 14285 with strong momentum, the risk of a deeper pullback remains.
📈 TECHNICAL ANALYSIS
Key Support and Resistance Levels
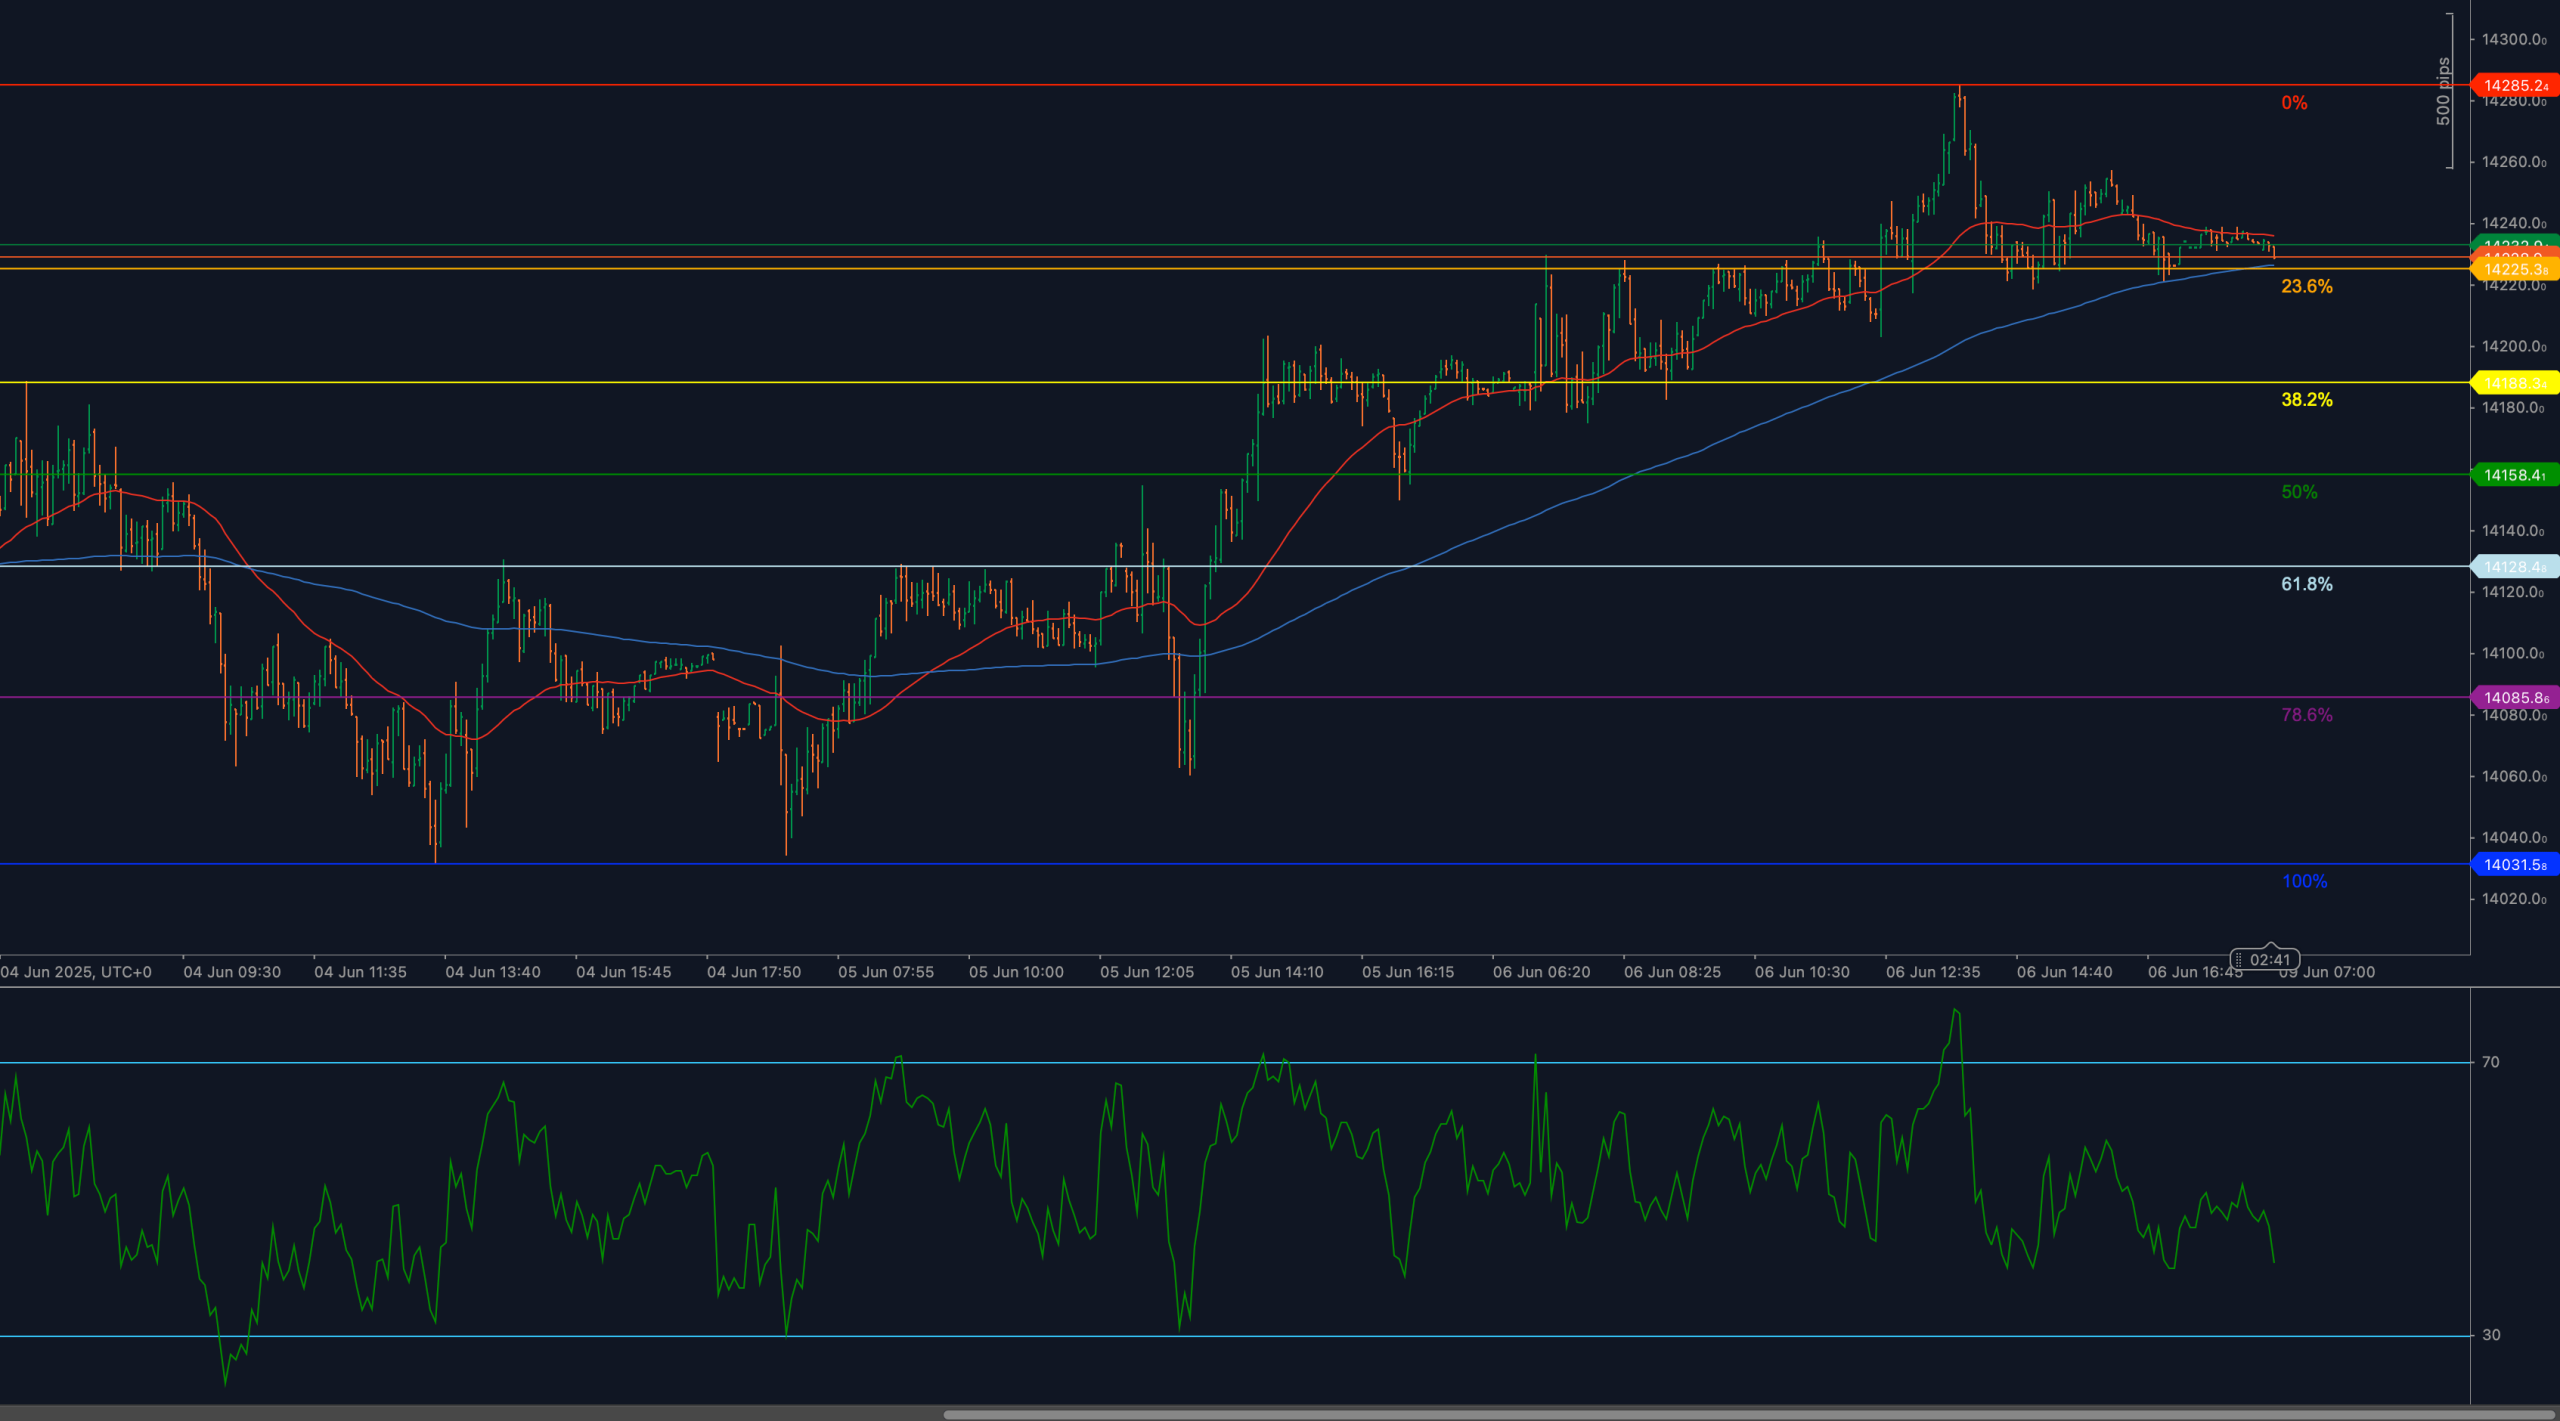
The key resistance remains at 14285.2 — the peak of the recent advance. Price tested this level twice and failed to break through, suggesting a possible short-term ceiling. On the downside, the first line of defense is the 23.6% Fibonacci retracement at 14229.5. A sustained break below this level could open the door to a broader pullback toward 14180.1 (38.2%) and 14156.4 (50%). These zones align with prior congestion and would serve as natural reaction points in the event of further selling. To reignite bullish momentum, the index must clear 14285 with volume and sustain above it, opening potential targets at higher extension levels.
Moving Averages and Dynamic Price Action
ESP35 remains supported by both the 50-period and 200-period WMAs, which are now converging near the 14230 zone — further strengthening the support structure around the 23.6% retracement. The 50-WMA has begun to flatten, reflecting the slowing pace of the advance, while the 200-WMA maintains a gentle upward slope. As long as price holds above this dual average support zone, the broader trend bias remains upward. However, any close below the 200-WMA would suggest that bears are beginning to take control, increasing the probability of further decline.
RSI Momentum and Bearish Pressure
The 14-period RSI has dropped from recent highs near 66 and is currently drifting toward the neutral 50 line. This drop reflects weakening bullish momentum and growing indecision among market participants. If RSI continues lower and falls below 45, it would confirm a loss of trend strength and likely coincide with a break below 14229.5. For bullish conviction to reassert itself, RSI must rebound above 60 with price reclaiming higher levels. Without this confirmation, sellers are likely to remain active on rallies.
Candlestick Behavior and Price Action Clarity
Recent candles show tight bodies and mixed upper and lower wicks — a classic pattern of consolidation and indecision. Several failed attempts to break above 14285 have been met with soft volume and lack of follow-through. There is also no evidence of strong bullish reversal candles near the 23.6% support, which suggests buyers are not aggressively stepping in at current levels. If bearish candlestick formations begin to emerge — such as engulfing patterns or bearish rejection near 14260–14270 — a deeper retracement becomes more likely.
Chart Structure and Breakdown Formation
The current structure represents a consolidation wedge forming just beneath the high of the move. Price is respecting the Fibonacci levels with tight rangebound behavior, but without breakout strength. This type of structure often resolves with a directional breakout, and the failure to breach 14285 now puts pressure on the lower boundary at 14229.5. A breakdown below this support would confirm a near-term topping formation and likely lead to a measured retracement toward the 38.2% and 50% levels. The bulls remain in control as long as the price holds above the 200-WMA, but the setup is vulnerable unless momentum returns.
Fibonacci Retracement and Extension Levels
The retracement drawn from 14031.5 (June 4 low) to 14285.2 (June 5 high) shows price hovering near the 23.6% Fibonacci support at 14229.5. If this support breaks, the 38.2% retracement level at 14180.1 and the 50% midpoint at 14156.4 are the next targets. These zones have acted as natural inflection points during prior rallies and may provide strong reactions. A deeper correction would expose 14128.0 (61.8%) and potentially 14086.8 (78.6%). To shift back into bullish continuation, price must reclaim 14285 and break into a new extension cycle. The current Fibonacci structure is defining the entire short-term trend logic, acting as both support ladder and directional roadmap.
🔍 MARKET OUTLOOK & TRADING SCENARIOS
Bullish Scenario
If price continues to hold above 14229.5 and RSI stabilizes near 50 or bounces above 60, a breakout attempt above 14285 remains possible. A confirmed move above this high would reassert the uptrend and open room toward new extension targets.
Neutral Scenario
Rangebound trading between 14229.5 and 14285 with RSI meandering between 45–60 suggests consolidation and potential energy build-up before a breakout or breakdown. This scenario may persist until a directional catalyst emerges.
Bearish Scenario
A clean break below 14229.5 with RSI falling under 45 would signal increased downside pressure. Targets would include 14180.1, 14156.4, and potentially 14128.0 as the retracement sequence extends lower.
💼 TRADING CONSIDERATIONS
Short-term traders should monitor price behavior at 14229.5 closely. A firm rejection or breakdown could offer short entries toward the 14180–14156 zone. Conversely, a confirmed breakout above 14285 with volume and RSI support may trigger long setups targeting new highs. Use disciplined stop placement around Fibonacci levels.
🏁 CONCLUSION
ESP35 is consolidating beneath 14285 with support clustered around 14229.5. Momentum is fading and price remains in a tight range. Bulls must defend 14229.5 and reclaim the recent highs to continue the trend. Otherwise, deeper Fibonacci retracements may come into play, bringing 14180.1 and 14156.4 into focus.
⚠️ DISCLAIMER
This analysis is for informational purposes only and does not constitute financial advice. Always consult with a licensed financial professional before making trading decisions.


