
📊 MARKET OVERVIEW
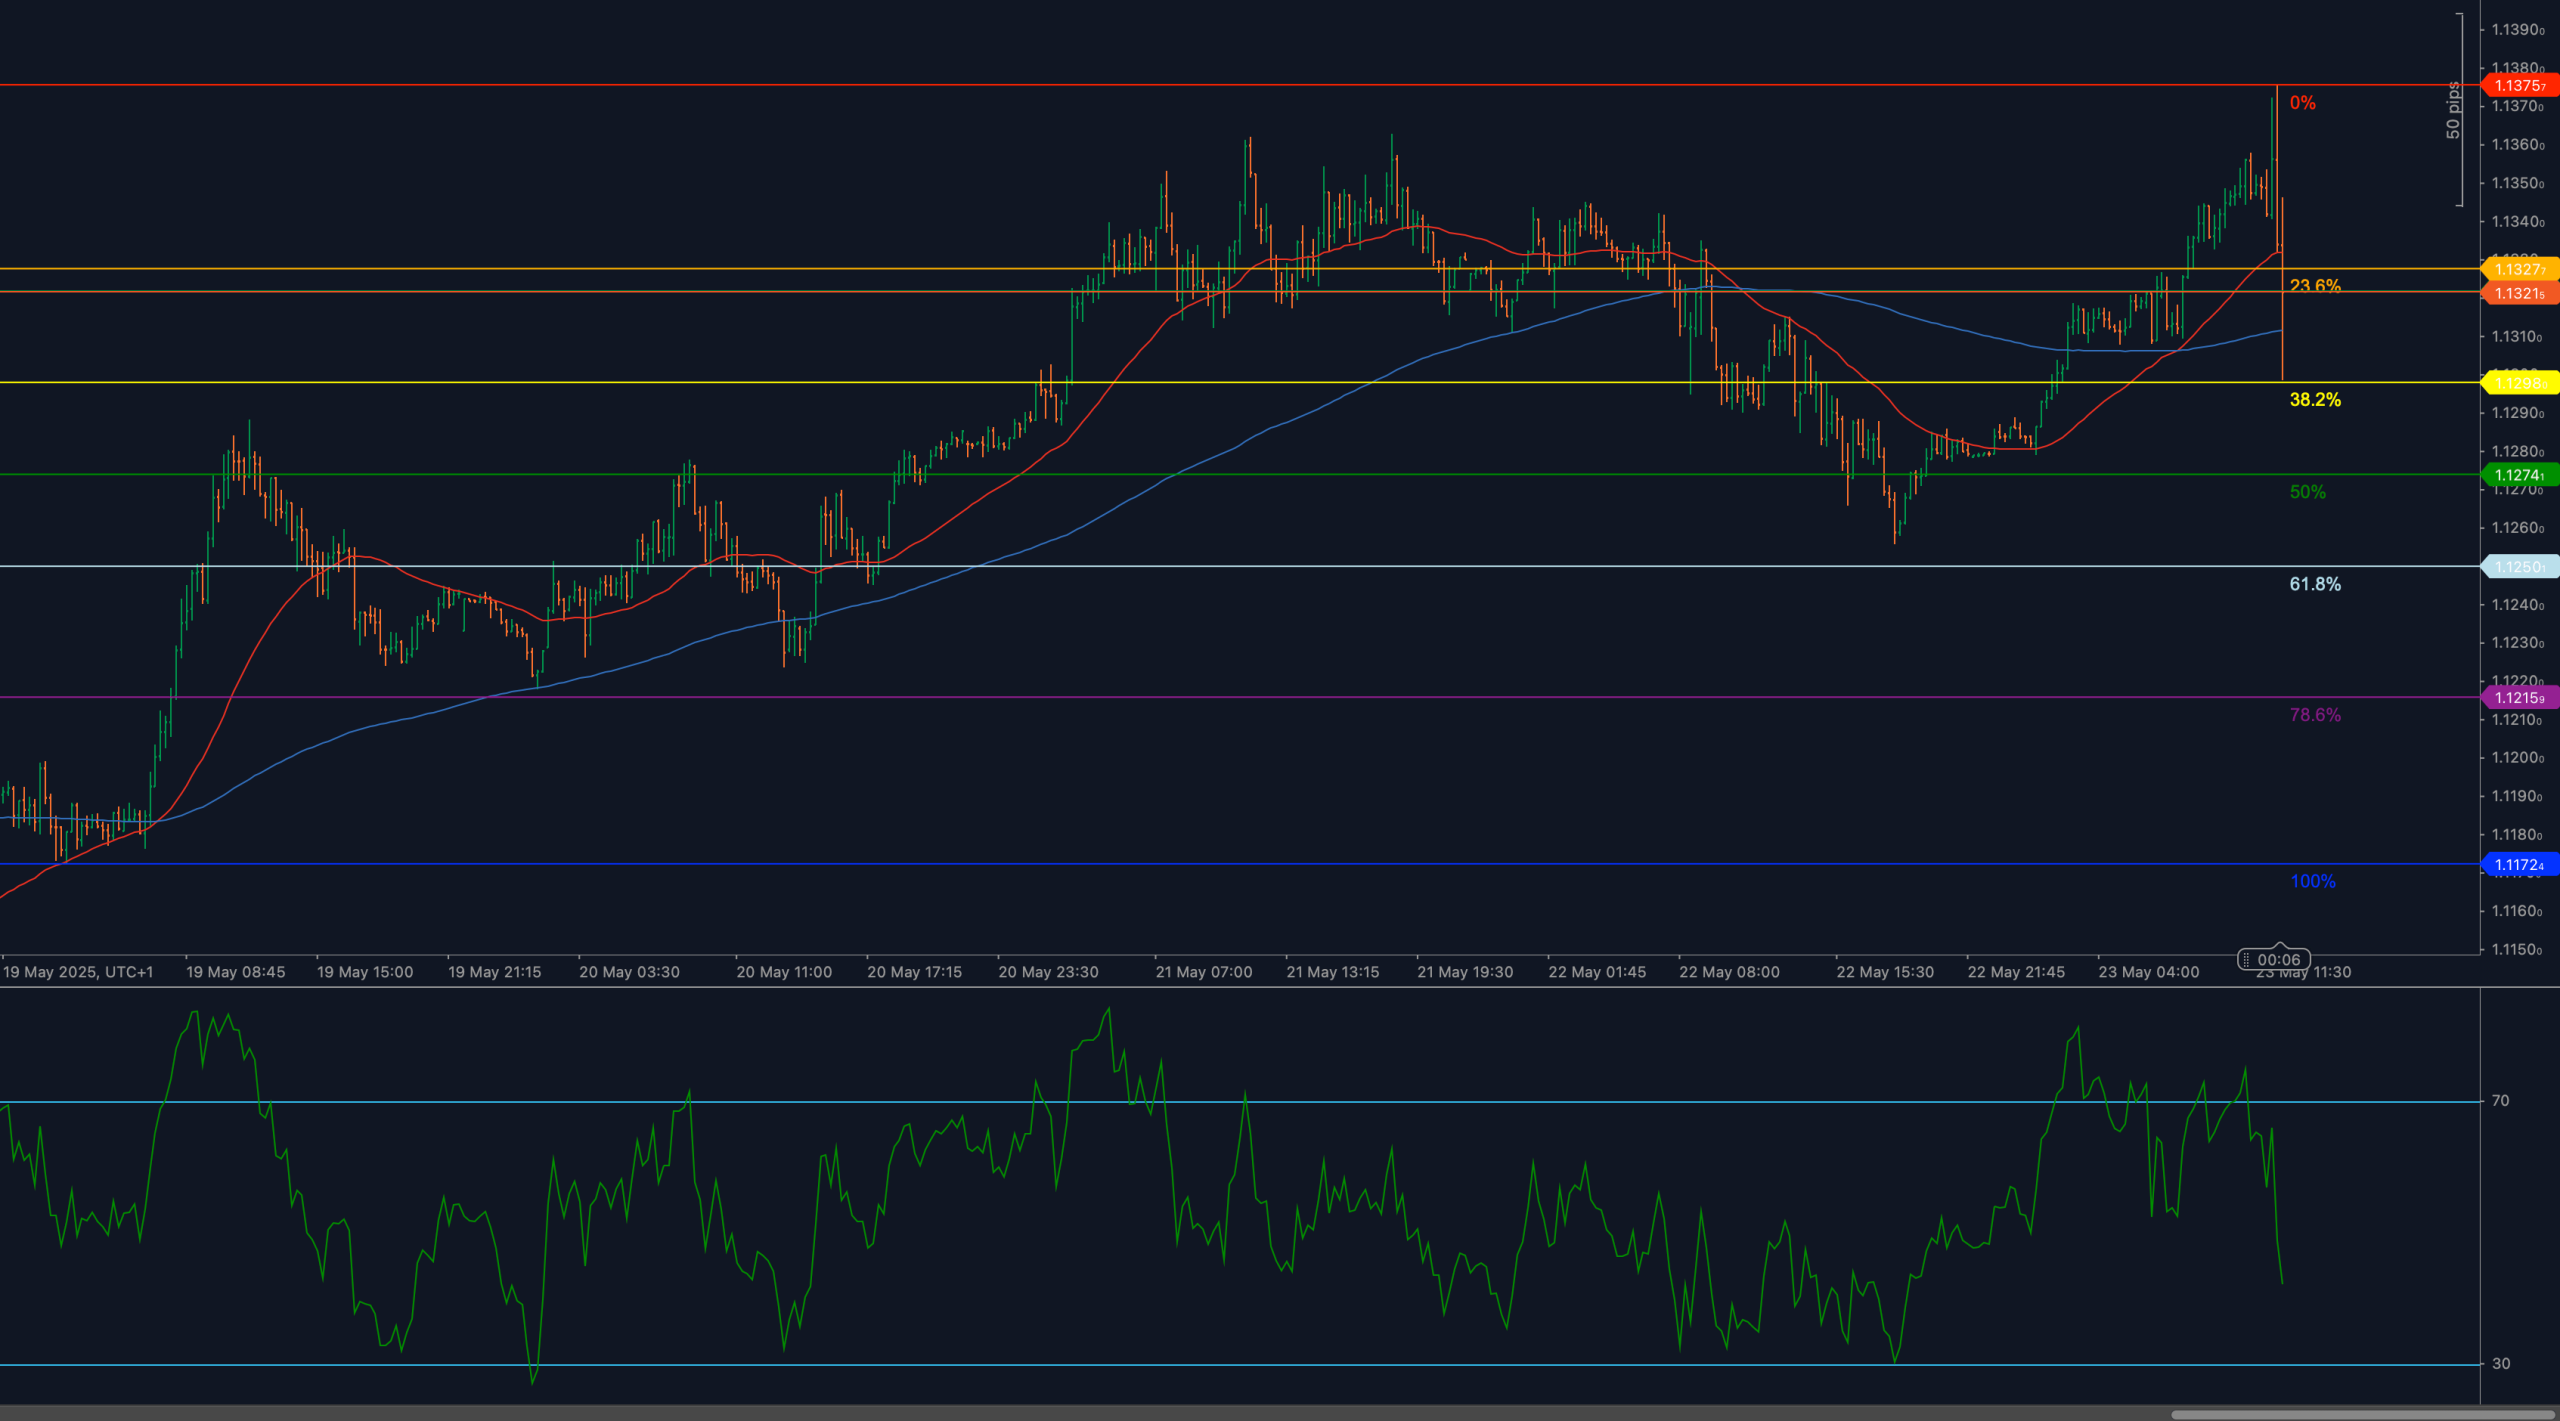
EUR/USD staged a sharp intraday reversal after testing 1.1385, failing to sustain above the previous high and breaking below the 23.6% Fibonacci retracement at 1.1327. The rejection marks a significant failure at resistance, with bearish pressure now emerging as RSI rolls off its overbought zone.
The euro had rallied strongly in recent sessions, but the inability to hold gains at the highs reflects an exhaustion point. Unless price reclaims 1.1327, the focus shifts to deeper support levels as sentiment deteriorates in the short term.
📈 TECHNICAL ANALYSIS
Key Support and Resistance Levels
The key resistance is defined at 1.1385, the local swing high. A return and breakout above this level would resume bullish continuation toward the psychological 1.1400 zone. Below current price, the immediate support rests at 1.1327, which has now been broken intraday.
A confirmed close below 1.1327 opens downside risk toward the 38.2% retracement at 1.1290, followed by the 50% retracement at 1.1274. These levels are likely to serve as potential reaction zones or bear targets if momentum extends.
Moving Averages and Dynamic Price Action
Price has broken back below the 50-period weighted moving average, and the 200-WMA near 1.1315 may now act as a test zone for structure. This rejection pattern shifts momentum to neutral-bearish unless bulls can reclaim these averages in the coming sessions.
If both moving averages fail to hold, the short-term structure risks evolving into a deeper correction leg.
RSI Momentum and Bearish Pressure
The 14-period RSI has turned lower from overbought, falling sharply below 60 after peaking just under 70. This confirms a momentum fade and adds weight to the bearish reversal. If RSI breaks below 50, it would confirm trend exhaustion and align with deeper downside risk toward 1.1290 and below.
Only a rebound above 60 would begin to repair momentum outlook.
Candlestick Behavior and Price Action Clarity
Price action shows a clear rejection candle from 1.1385, followed by strong-bodied bearish follow-through that took price below prior Fibonacci support. The sequence signals decisive selling pressure and loss of short-term control by bulls.
Unless a bullish engulfing pattern or support recovery emerges near 1.1290–1.1274, bears are likely to retain momentum.
Chart Structure and Breakdown Formation
The overall structure remains bullish in the medium term, but the sharp rejection suggests a short-term top has formed. The loss of 1.1327 and subsequent move into deeper Fibonacci territory indicates a breakdown from the immediate rally phase.
The chart now resembles a potential double-top failure at 1.1385, with downside scope into the mid-retracement band. Structure remains vulnerable unless bulls reclaim 1.1327 swiftly.
Fibonacci Retracement and Extension Levels
The Fibonacci retracement drawn from 1.1172 (May 19 low) to 1.1385 (May 22 high) outlines the current pullback structure. The 23.6% retracement at 1.1327 has failed, and price is pressing toward the 38.2% level at 1.1290.
Further downside would target the 50% retracement at 1.1274, and a deeper move could bring the 61.8% retracement at 1.1250 into focus. If this zone also fails, a full correction toward the 78.6% level at 1.1215 or even 1.1172 could unfold.
To the upside, recovery above 1.1327 would stabilize structure and allow for retest of 1.1350, followed by renewed focus on 1.1385.
🔍 MARKET OUTLOOK & TRADING SCENARIOS
Bullish Scenario
A close back above 1.1327, supported by RSI holding above 55, would ease downside pressure. Bulls would then aim for 1.1350 and potentially retest 1.1385 if recovery gains traction.
Neutral Scenario
Sideways price action between 1.1290–1.1327, with RSI between 50–60, would signal indecision. Structure would remain vulnerable without a confirmed bounce.
Bearish Scenario
A breakdown below 1.1290, especially with RSI falling below 50, would activate targets at 1.1274, 1.1250, and potentially 1.1215.
💼 TRADING CONSIDERATIONS
Bears may remain in control below 1.1327, targeting lower Fib zones. Bulls should avoid long setups until structure is reclaimed. Breakout traders can monitor support behavior near 1.1290 for reversal signs or continuation setups.
🏁 CONCLUSION
EUR/USD has sharply reversed from 1.1385, breaking below 1.1327 and exposing downside toward 1.1290 and 1.1274. With RSI fading, momentum favors correction unless bulls recover key levels quickly.
⚠️ DISCLAIMER
This analysis is for informational purposes only and does not constitute financial advice. Always consult with a licensed financial professional before making trading decisions.


