
📊 MARKET OVERVIEW
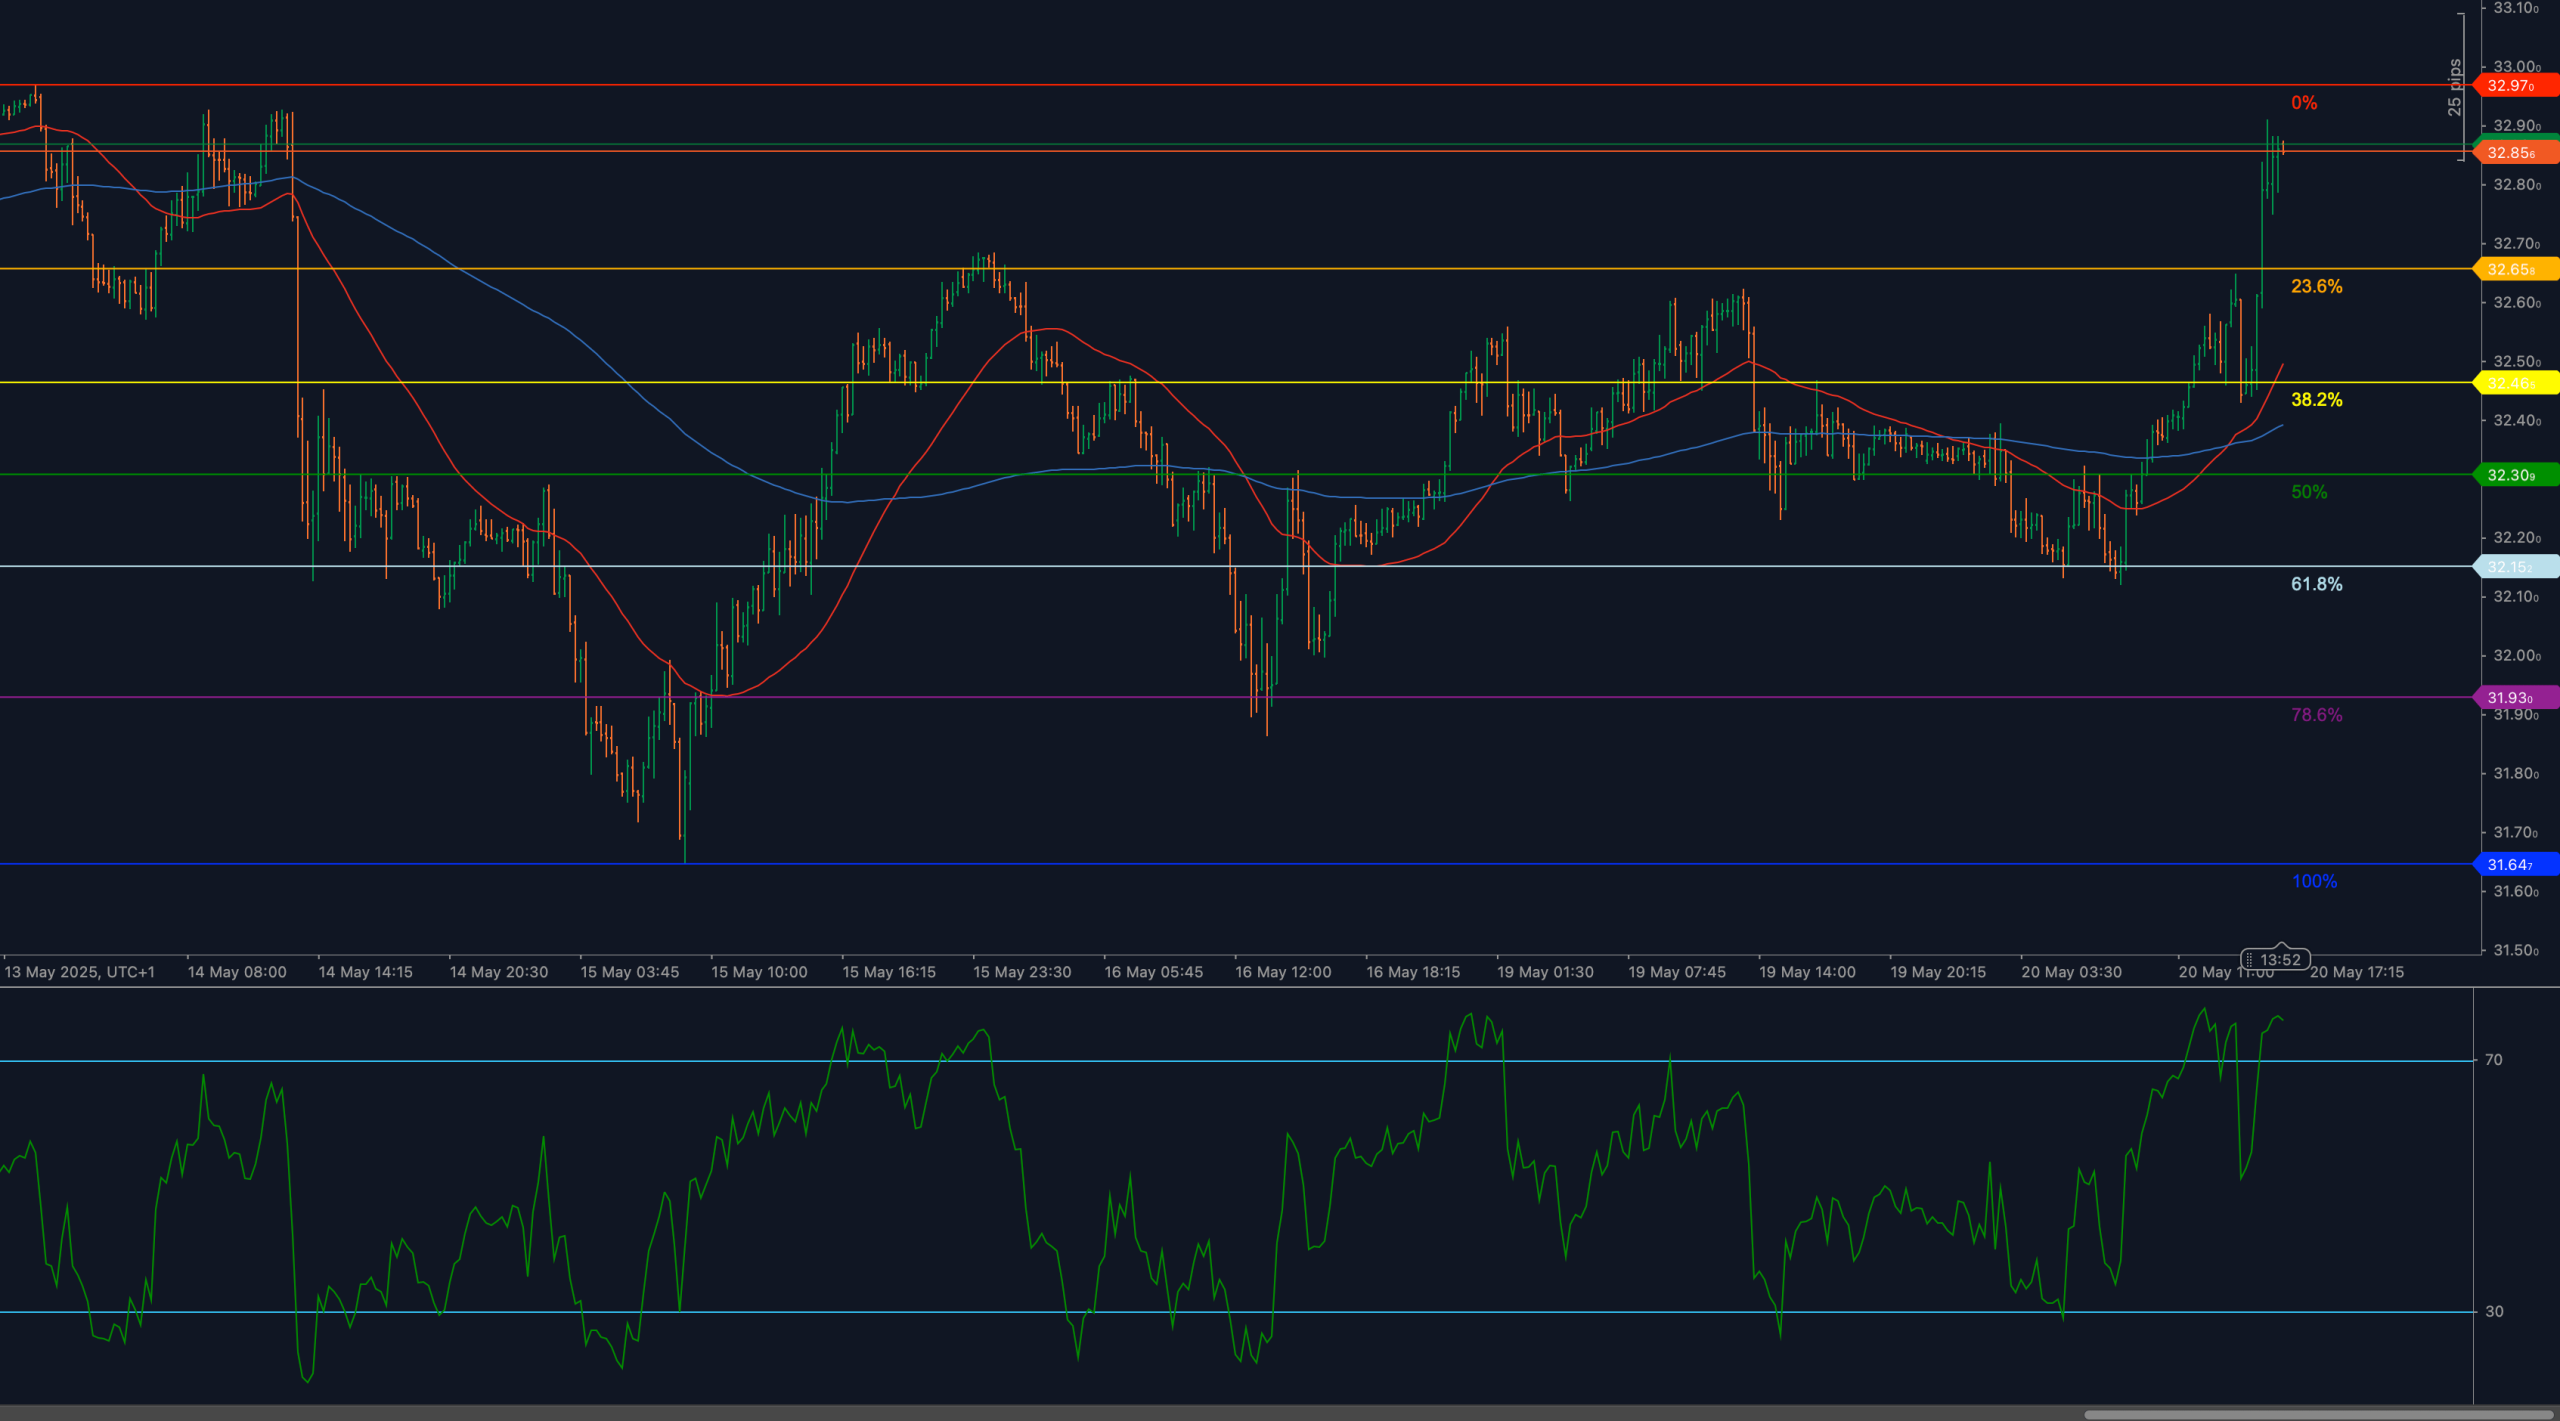
Silver surged sharply during the latest session, clearing the 32.86 resistance zone and extending toward a fresh high at 32.97. The breakout comes amid sustained momentum in metals markets and renewed bullish interest following last week’s consolidation. With this move, XAG/USD has broken out of its recent range and entered into expansion territory above the 23.6% Fibonacci retracement level.
RSI has pushed decisively above 70, confirming overbought conditions, but also validating the strength of the underlying trend. While buyers remain in control, a pause or retracement could emerge to absorb recent gains, especially if momentum fails to extend further above 33.00 without consolidation.
📈 TECHNICAL ANALYSIS
Key Support and Resistance Levels
The immediate resistance now sits at 32.97, which marks the current local high. A breakout above this level would initiate a new impulse leg with upside extension potential toward the psychological 33.20–33.40 area. The key breakout zone at 32.86, formerly resistance, now turns into first dynamic support.
Below that, next support is seen at 32.66, aligning with the 23.6% Fibonacci retracement, followed by 32.30, which marks the 38.2% retracement and the top of the prior consolidation structure. If momentum falters, these levels may provide dip-buying opportunities.
Moving Averages and Dynamic Price Action
Price is firmly above both the 50-period and 200-period weighted moving averages, with the 50-WMA turning steeply higher and providing dynamic support near 32.20. The 200-WMA remains well below at 31.85, underscoring the strength of the medium-term uptrend.
As long as price remains above these key averages, momentum remains strongly bullish. A retracement toward the 50-WMA would be considered healthy in the context of trend continuation.
RSI Momentum and Bullish Pressure
The 14-period RSI has pushed well above 70, reaching overbought territory as the latest breakout extended. This confirms strong bullish pressure but also warns of possible short-term exhaustion. A failure to accelerate above 33.00may trigger a cooling-off period, especially if RSI rolls lower below 68–65.
That said, in strong trend phases, RSI can remain elevated for extended periods — so unless divergence or a sharp drop occurs, bullish control remains dominant.
Candlestick Behavior and Price Action Clarity
Recent candlesticks show wide-bodied bullish breaks with clean closes above former resistance, followed by only shallow upper wicks. This suggests a true breakout rather than a fakeout. No reversal signals are visible for now, and momentum candles reinforce conviction.
If a rejection candle or long upper shadow appears near 32.97, it may hint at consolidation, but until then, buyers continue to dictate pace.
Chart Structure and Breakout Formation
The broader chart shows a clean breakout from a multi-session range that had been capped near 32.66–32.86. After testing and holding the 50-WMA, price built higher lows and broke through resistance decisively. The structure confirms a bullish breakout formation, with continuation bias favored unless the recent breakout level is lost.
The move above 32.86 completes a short-term flag breakout and opens the door for potential continuation toward upper expansion zones, provided buyers can defend gains above 32.66.
Fibonacci Retracement and Extension Levels
The Fibonacci retracement drawn from 31.64 (May 16 low) to 32.97 (May 20 high) defines the active structure. Following the breakout, price has cleared the 0% retracement and now resides in potential extension territory.
Support now rests at the 23.6% retracement at 32.66, which may act as the first pullback area. Below that, the 38.2% retracement at 32.30 aligns with former resistance and short-term structural support. The 50% level at 32.20 marks the dynamic mid-zone near the 50-WMA. A deeper correction could reach 61.8% at 31.95, though this remains unlikely unless the breakout fully fails.
If price sustains above 32.97, Fibonacci extension projections lie at 33.20, then 33.40, which would represent the next phase of trend continuation.
🔍 MARKET OUTLOOK & TRADING SCENARIOS
Bullish Scenario
If XAG/USD holds above 32.86 and consolidates above 32.66, the breakout remains valid. A close above 32.97 would initiate a fresh leg toward 33.20–33.40, with RSI maintaining above 68–70.
Neutral Scenario
Price stalls between 32.66 and 32.97, while RSI holds elevated but flattens. This would suggest a short-term digestion phase before either continuation or rejection.
Bearish Scenario
A break below 32.66, especially with RSI dropping below 65, would expose support at 32.30 and 32.20. A deeper move could reach 31.95, invalidating the breakout structure.
💼 TRADING CONSIDERATIONS
Breakout traders may stay long above 32.66 with stops below 32.30 and targets toward 33.20. Countertrend traders may look for reversal candles near 32.97 for tactical fade attempts, but must respect trend strength unless RSI and price diverge.
🏁 CONCLUSION
Silver has broken decisively above 32.86, with price surging toward 32.97 and RSI entering overbought. Momentum remains bullish, but extended conditions could lead to consolidation or minor pullback. As long as 32.66 holds, the path of least resistance remains higher, targeting 33.20 next.
⚠️ DISCLAIMER
This analysis is for informational purposes only and does not constitute financial advice. Always consult with a licensed financial professional before making trading decisions.


