
📊 MARKET OVERVIEW
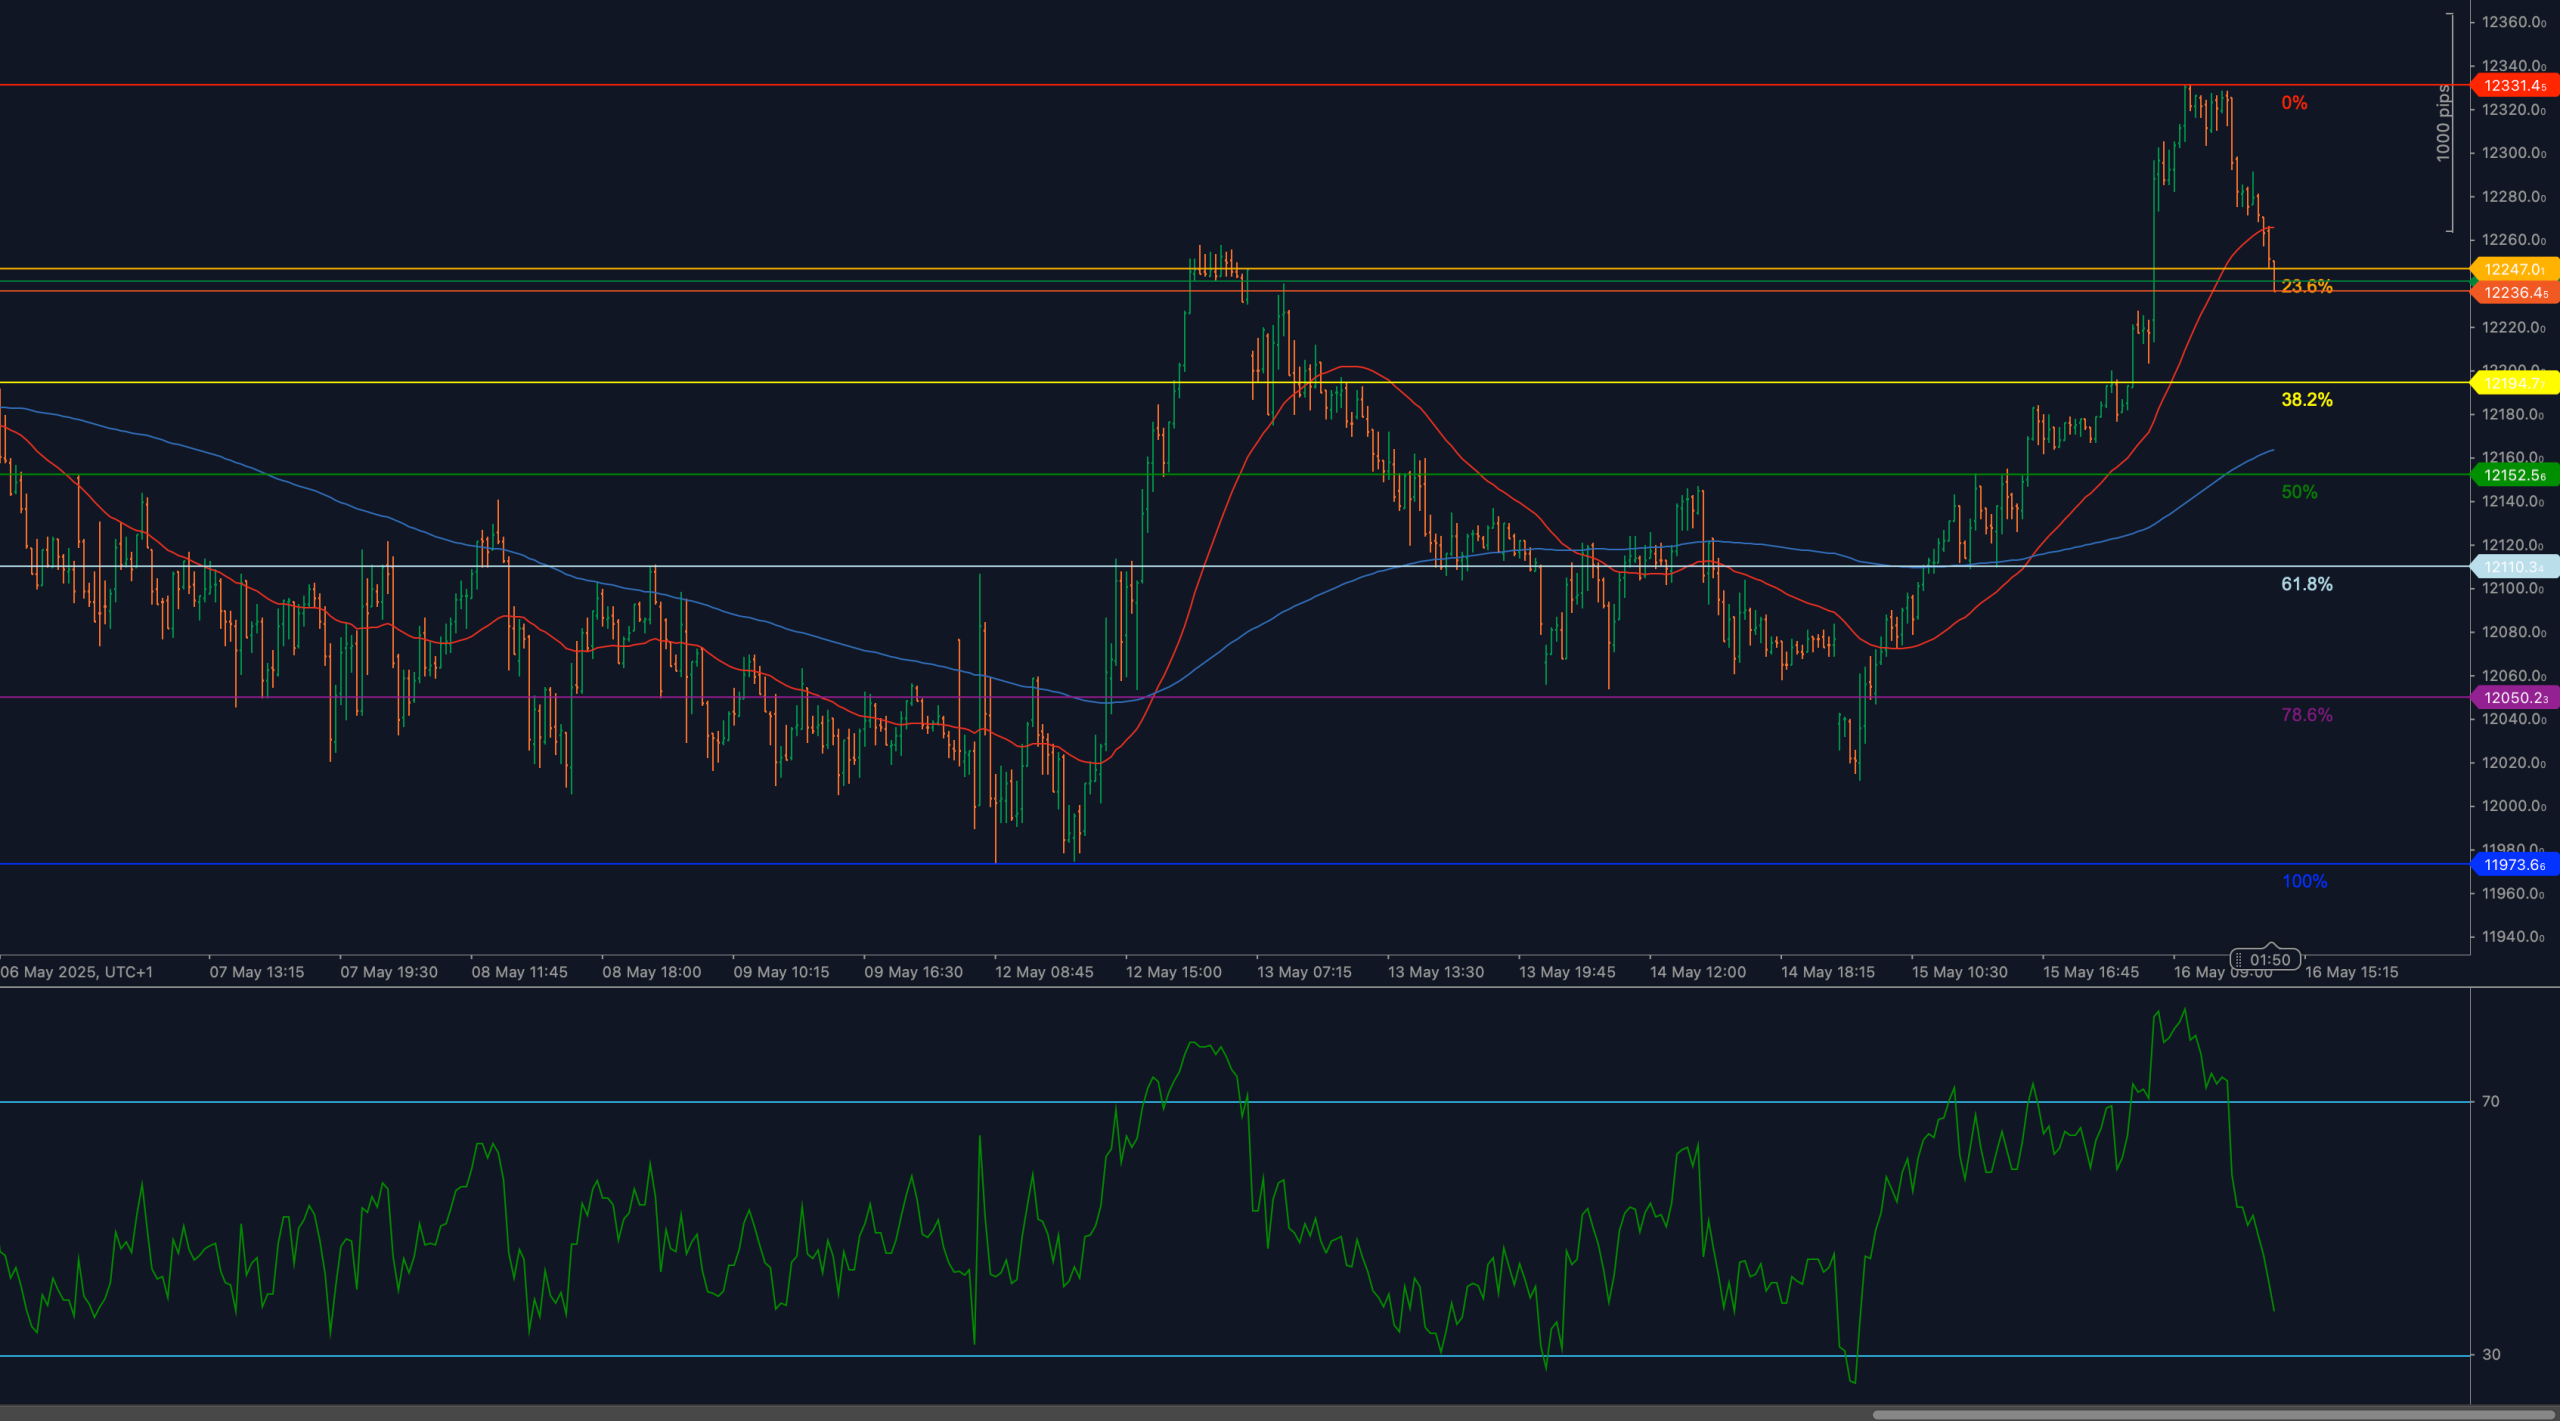
SMI20 has slipped lower after a strong early-May rally that peaked at 12,331. Price has now broken below 12,225, the 23.6% Fibonacci retracement level of the recent advance from 11,973.6 to 12,331.4. This confirms the start of a deeper correction phase, with momentum rolling over and RSI confirming reversal behavior. The earlier upside was fueled by broad equity strength and CHF softness, but profit-taking and weakening sentiment have begun to weigh on price action.
With RSI declining and both major moving averages flattening, the short-term technical structure is turning neutral to bearish. Unless bulls can reclaim higher ground above 12,280 and hold 12,225, the index risks sliding toward deeper support zones.
📈 TECHNICAL ANALYSIS
Key Support and Resistance Levels
The immediate resistance now lies at 12,225 — the broken 23.6% Fibonacci retracement. A move back above this level would be the first sign of bullish stabilization. Above that, 12,280 serves as the key short-term pivot, and 12,331marks the top of the May impulse leg.
To the downside, immediate support rests at 12,156.6, the 38.2% retracement of the current leg. A confirmed breakdown would target 12,096.6 (50% retracement) and potentially extend to 12,036.6 (61.8%) and 12,009.5 (78.6%). A full retracement to 11,973.6 would mark a total unwind of the May rally and shift medium-term sentiment to bearish.
Moving Averages and Dynamic Price Action
Price has slipped below both the 50-period and 200-period weighted moving averages, with the 50-WMA beginning to turn lower and the 200-WMA flattening. This confirms a loss of bullish momentum and a potential shift toward consolidation or trend reversal. The 50-WMA, previously a support driver, now acts as dynamic resistance near 12,240.
Unless the index quickly reclaims both moving averages, short-term rallies are likely to be faded. A bearish crossbetween the two MAs in coming sessions would reinforce bearish control.
RSI Momentum and Bearish Pressure
The 14-period RSI has dropped from overbought levels near 72 and now trades near 44, reflecting a significant deterioration in momentum. The indicator failed to hold above 55 and has since moved below 50, confirming a transition from bullish to neutral-bearish behavior.
If RSI dips below 40, it would mark the beginning of stronger bearish pressure and support a continuation of the corrective leg. Only a break back above 55–60 would restore bullish momentum and signal a potential base.
Candlestick Behavior and Price Action Clarity
Recent candlesticks show a clear reversal pattern, with long upper wicks near 12,331 and increasingly bearish bodies toward 12,225. The failure to hold the Fib support has been confirmed with successive closes below key levels, and no bullish engulfing or reversal patterns are currently present.
The sequence now favors bearish continuation unless a strong bullish candle reclaims 12,225 with follow-through. Until then, pressure remains on the downside with short-term structure tilting bearish.
Chart Structure and Breakdown Formation
The structure of SMI20 reflects a clean retracement after an impulsive rally. The inability to maintain gains above 12,280 confirms that the prior move was exhausted, and the transition toward a corrective leg is underway. Price is forming a rounded top beneath key resistance, and the breakdown through 12,225 supports this shift in structure.
Bulls have failed to produce higher highs since 12,331, and with both RSI and price patterns confirming weakness, the probability of continued pullback into the 12,096–12,036 zone is rising.
Fibonacci Retracement and Extension Levels
The Fibonacci retracement from 11,973.6 (May 10 low) to 12,331.4 (May 16 high) outlines the current structure. Price has already breached the 23.6% level at 12,225.6 and is now targeting the 38.2% retracement at 12,156.6. If that level fails, deeper correction into the 50% retracement at 12,096.6 becomes likely.
A break below 12,096.6 would expose 12,036.6 (61.8%) and 12,009.5 (78.6%). A full retracement back to 11,973.6would represent a complete unwind of the May leg. Below that, bearish extension targets could project toward 11,910–11,870 if momentum accelerates.
🔍 MARKET OUTLOOK & TRADING SCENARIOS
Bullish Scenario
A strong recovery above 12,225 and back through 12,280 would neutralize current bearish pressure. If price closes above 12,331, the original uptrend resumes. RSI must climb back above 55 to validate a bullish reversal.
Neutral Scenario
Consolidation between 12,156 and 12,225 would indicate indecision. RSI holding in the 45–50 range and price fluctuating inside the retracement band would support a wait-and-see approach. Traders would monitor for breakout or breakdown signals.
Bearish Scenario
A clean break below 12,156.6, followed by RSI losing 40, would confirm downside continuation. This would set up a test of 12,096.6 and potentially deeper levels at 12,036.6 or 12,009.5. Full retracement back to 11,973.6 would shift trend structure entirely.
💼 TRADING CONSIDERATIONS
Sellers are in control below 12,225. Short entries may be considered on rejection near this level, with downside targets at 12,156 and 12,096. Bulls must wait for price to reclaim 12,225 and RSI to move above 55 before re-engaging. Until structure improves, rallies are likely to be faded.
🏁 CONCLUSION
SMI20 has broken below the 23.6% Fibonacci retracement at 12,225, confirming the beginning of a deeper pullback. RSI has turned sharply lower, moving averages are weakening, and price action reflects growing bearish pressure. Unless bulls reclaim lost ground above 12,280, the correction is likely to extend toward 12,156 and 12,096.
⚠️ DISCLAIMER
This analysis is for informational purposes only and does not constitute financial advice. Always consult with a licensed financial professional before making trading decisions.


