
📊 MARKET OVERVIEW
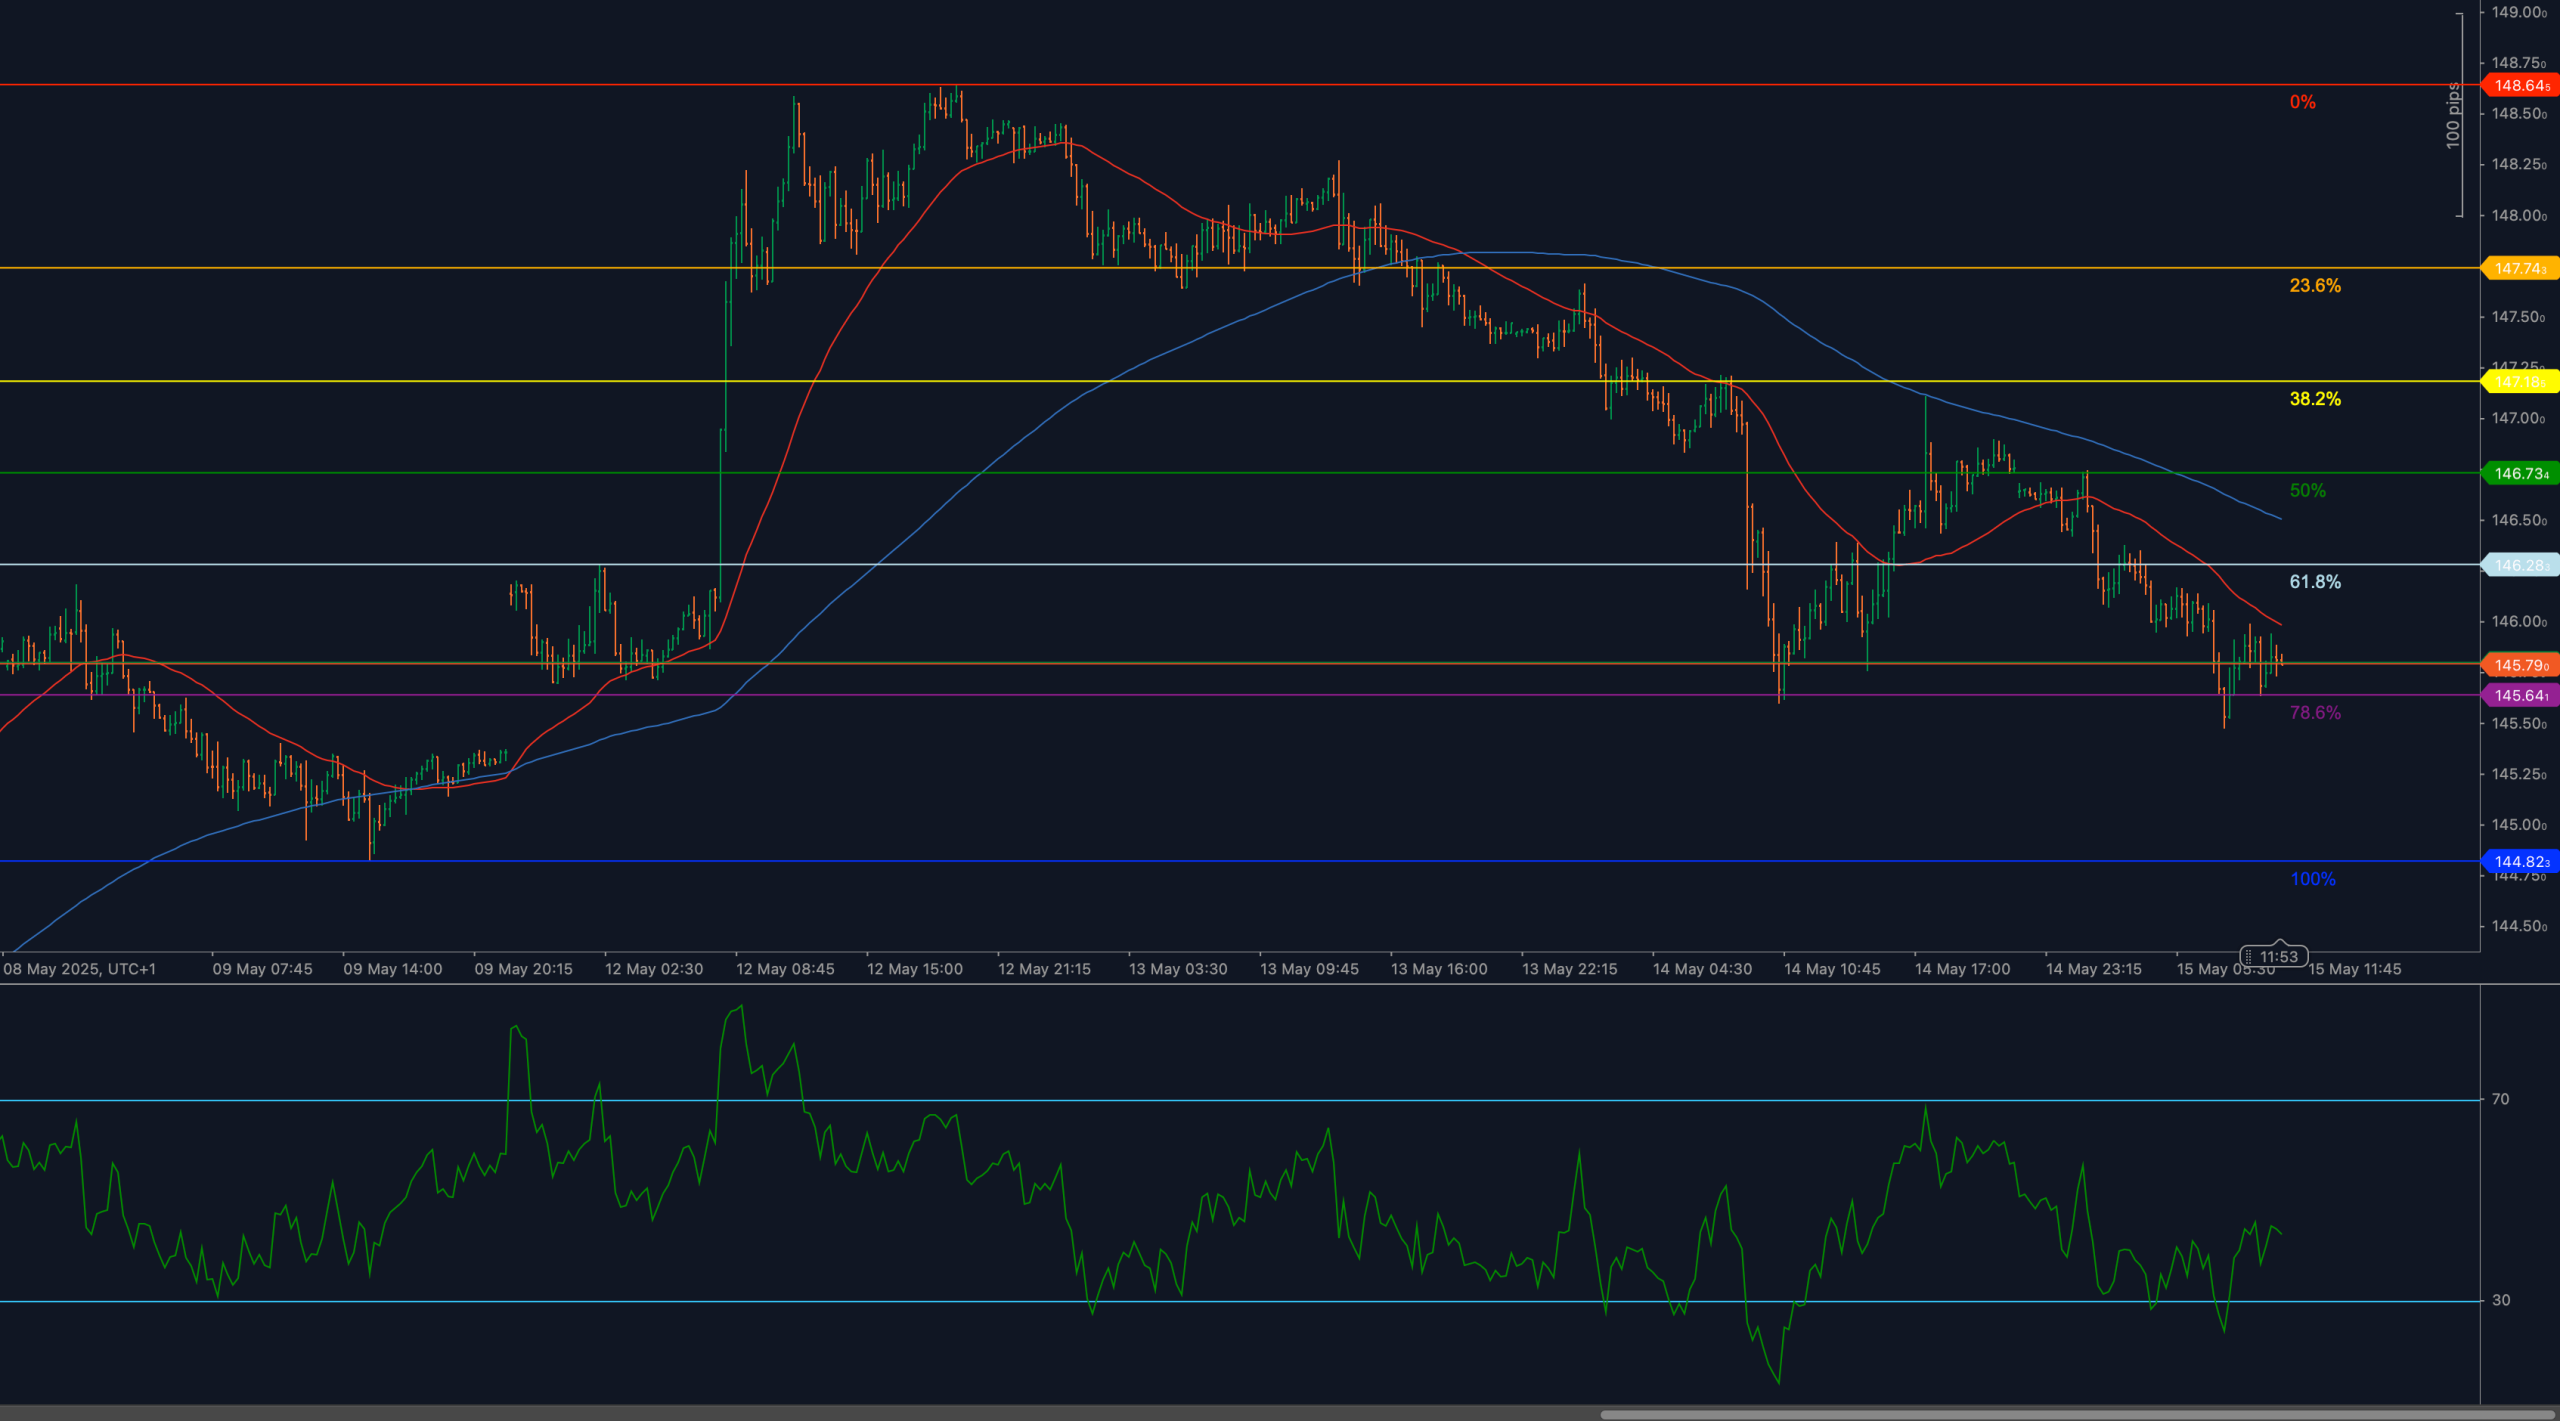
USD/JPY has continued to slide following its post-CPI spike toward 148.64, which marked a key local high before a sustained reversal. The pair is now trading below 145.79, the 78.6% Fibonacci retracement of the prior leg, and price action shows no sign of renewed bullish control. After a short-lived recovery attempt earlier in the week, sellers have reasserted dominance, keeping the pair beneath both major moving averages and within a controlled bearish channel.
The backdrop includes easing U.S. Treasury yields and a mild reassertion of yen strength amid safe-haven repositioning. Meanwhile, the Bank of Japan remains structurally dovish but appears less reactive in current cycles, offering little fundamental resistance to occasional JPY bids. For now, momentum remains skewed toward further downside unless buyers regain structure above 146.28.
📈 TECHNICAL ANALYSIS
Key Support and Resistance Levels
The immediate resistance lies at 145.79, the 78.6% Fibonacci retracement from the May 12 low at 144.82 to the May 13 peak at 148.64. Price has tested this level repeatedly, but no decisive breakout has occurred. Above this, 146.28 — the 61.8% retracement and a pivot aligned with the 50-WMA — serves as a key breakout trigger. A sustained move above 146.28 could open the door for a retest of 146.73 (50% retracement) and possibly 147.74, the 23.6% Fib.
On the downside, immediate support lies at 145.64, the most recent local low. A breakdown here targets 144.82, the 100% retracement of the recent swing. A close below 144.82 would not only complete the retracement but also expose price to broader downside expansion zones.
Moving Averages and Dynamic Price Action
Price is currently trapped beneath both the 50-period and 200-period weighted moving averages, with both averages sloping lower — a clear signal of bearish control. The 50-WMA, which served as dynamic support during the May rally, is now acting as a resistance barrier near 146.28, reinforcing that sellers are dictating momentum shifts.
The confluence between the 61.8% retracement and the 50-WMA makes 146.28 a structurally critical level. If bulls fail to break and close above it, short-term rallies are likely to be sold into. A bearish cross between the 50- and 200-WMAs would add further weight to the bearish case in coming sessions.
RSI Momentum and Bearish Pressure
The 14-period RSI remains suppressed below 50, currently trading near 44, reflecting weakening momentum and a lack of buyer strength. The RSI previously attempted to rebound but failed to hold above 55, further confirming the bearish character of the current leg.
Unless RSI breaks back above 50–55 and sustains momentum, downside continuation remains the favored outcome. A move below 40 would signal renewed bearish pressure and confirm a shift back into trend acceleration mode.
Candlestick Behavior and Price Action Clarity
Recent candles show a pattern of small-bodied formations with lower highs and clustered closes — a classic sign of consolidation under pressure. Several upper wicks formed near 145.79 highlight rejection at Fibonacci resistance, while downside candles have shown cleaner follow-through.
No reversal signals are present at this stage. Without bullish engulfing or hammer formations, current candle behavior supports the continuation of bearish structure unless invalidated by a sudden shift in participation or macro catalyst.
Chart Structure and Breakdown Formation
The structure of USD/JPY reflects a clean downward correction after an impulsive rally. The steep drop from 148.64 to 144.82 formed a broad retracement leg, and the failure to recover beyond 146.28 confirms that this rebound is corrective, not impulsive. The current price action resembles a bear flag developing beneath key resistance, and a confirmed break below 145.64 would likely trigger continuation toward full retracement levels.
Bulls have yet to produce any higher high, and the consistent lower highs combined with capped RSI and bearish MA alignment underscore the vulnerability of the pair.
Fibonacci Retracement and Extension Levels
The Fibonacci retracement from 144.82 (May 12 low) to 148.64 (May 13 high) outlines the key structural zones. Price has now failed to reclaim the 61.8% retracement at 146.28 and is trading beneath the 78.6% retracement at 145.79. A breakdown through 145.64 confirms full retracement toward 144.82, with potential bearish extension targets beyond.
If 144.82 breaks, bears may set sights on the 1.272 and 1.618 Fibonacci extensions projected from this retracement cycle — potentially targeting 144.30–143.90 depending on the strength of follow-through.
🔍 MARKET OUTLOOK & TRADING SCENARIOS
Bullish Scenario
A strong close above 145.79, followed by a reclaim of 146.28, would neutralize short-term bearish pressure and open the door for recovery toward 146.73 and higher. RSI must follow with a break above 55 to confirm reacceleration.
Neutral Scenario
Sideways trade between 145.64 and 146.28, with RSI fluctuating between 45–55, suggests consolidation. This range could persist while the market awaits macro catalysts or clarity on the dollar/yen rate differential.
Bearish Scenario
A break below 145.64, especially on strong-bodied candles and RSI losing 40, would likely trigger a deeper leg toward 144.82 and potentially beyond. Follow-through beneath this level would shift the broader structure back to trend continuation mode.
💼 TRADING CONSIDERATIONS
Bears are favored beneath 145.79, particularly on rejection signals or candle confirmation. Targets include 145.64, 144.82, and potential extension toward 144.30. Bulls must await breakout and reclaim of structure above 146.28 before considering trend reversal setups. Until that happens, rallies into resistance may continue to be faded.
🏁 CONCLUSION
USD/JPY remains under pressure beneath 145.79, with the 78.6% Fibonacci retracement capping any recovery efforts. Price structure is bearish, RSI remains weak, and both major moving averages are acting as dynamic resistance. Unless the pair reclaims 146.28, momentum favors further downside toward 144.82 and potentially deeper extension targets.
⚠️ DISCLAIMER
This analysis is for informational purposes only and does not constitute financial advice. Always consult with a licensed financial professional before making trading decisions.


