
📊 MARKET OVERVIEW
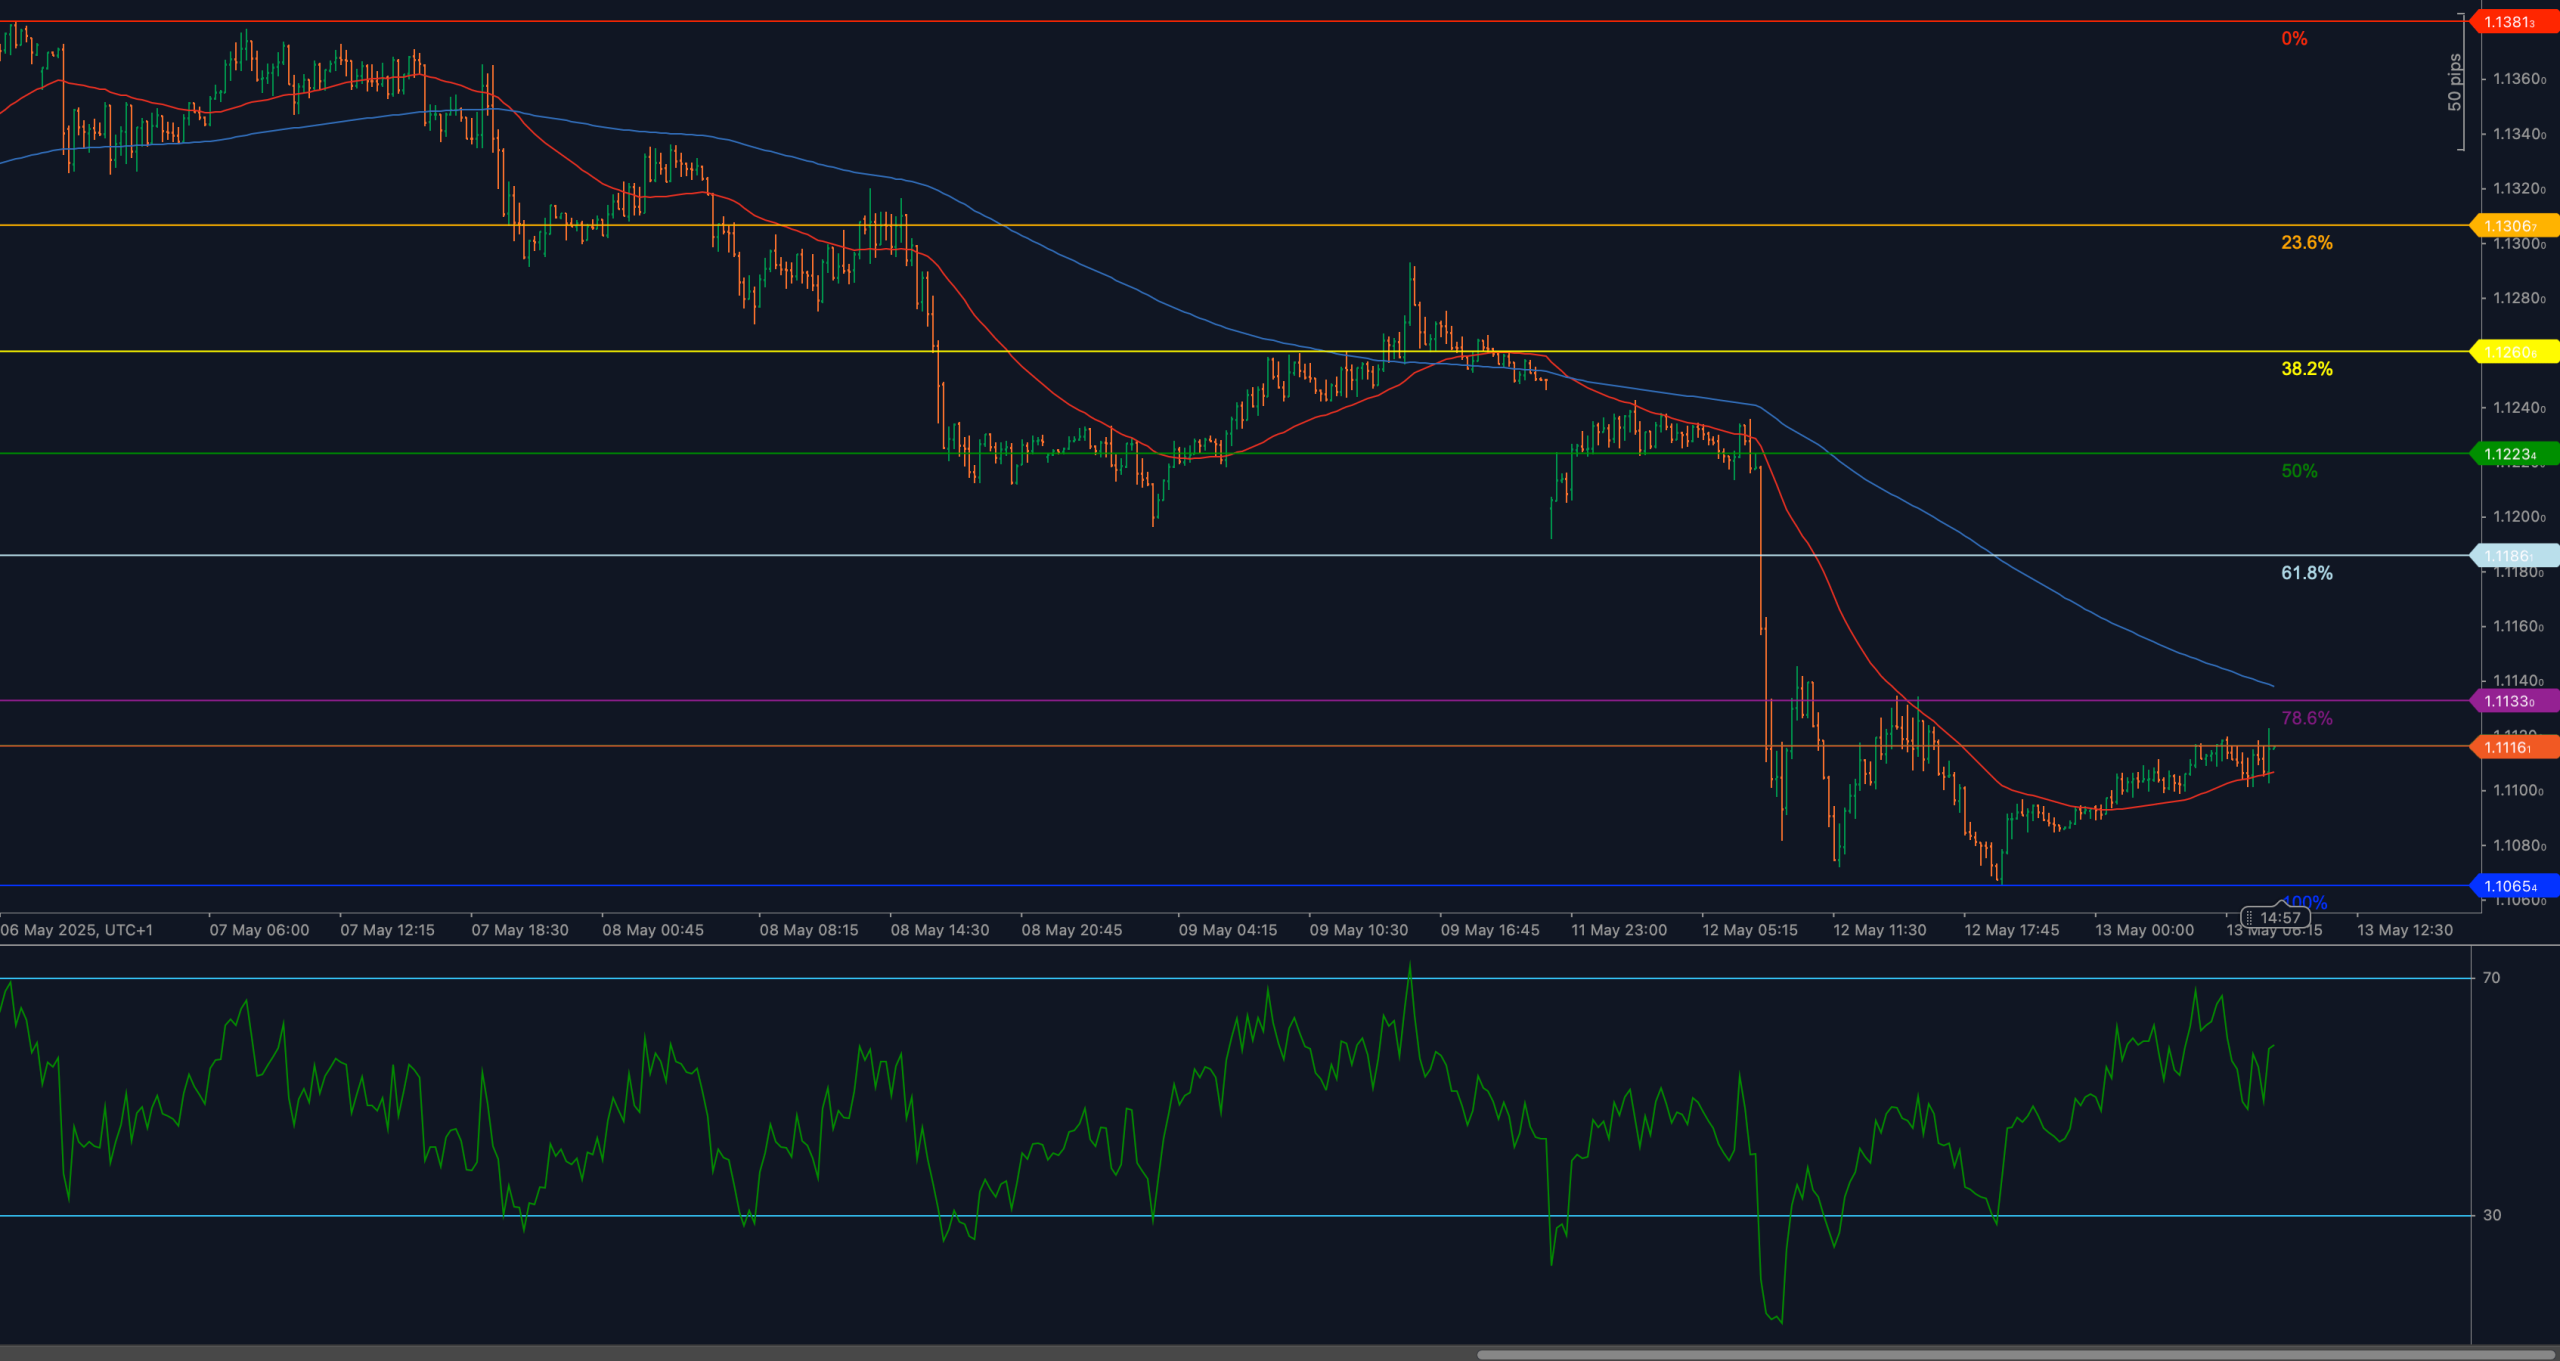
EUR/USD remains trapped within a corrective rebound that has so far failed to evolve into a sustainable bullish reversal. After bottoming out near 1.1065 in the May 10 session, the pair staged a moderate recovery but stalled just beneath the 1.1116 resistance level, which aligns with the 78.6% Fibonacci retracement of the recent bearish leg from 1.1381 to 1.1065.
The technical bounce followed weaker-than-expected U.S. CPI revisions and a short-lived uptick in eurozone yield spreads. However, the recovery appears tactical rather than structural, with the dollar quickly regaining ground as sentiment stabilizes and risk assets fade. The euro remains fundamentally fragile amid stagnant growth expectations and continued dovish ECB rhetoric, while U.S. data remains mixed but resilient enough to support the greenback above its recent lows.
Technically, EUR/USD remains structurally bearish until a break and close above 1.1133–1.1186 occurs, reclaiming both dynamic and horizontal resistance. For now, price is caught between minor intraday support at 1.1065 and bearish supply zones above 1.1116.
📈 TECHNICAL ANALYSIS
Key Support and Resistance Levels
The most critical near-term resistance is the 1.1116 level, corresponding with the 78.6% Fibonacci retracement of the prior decline. This zone has rejected price action three times intraday, showing its relevance not only as a Fibonacci level but also as a psychological and order flow barrier. A decisive break above this level, ideally accompanied by strong volume and candle body close, would open the door for a test of 1.1133, the previous swing high.
Beyond that, 1.1186 — the 61.8% retracement of the broader drop from mid-April highs — becomes the next major upside target. On the flip side, initial support is defined by 1.1065, the recent reaction low. If breached, bears may reassert control quickly, with deeper levels such as 1.1050 (a psychological round number and prior pivot) and 1.1005(a confluence of prior demand and retracement overlap) becoming immediate focus areas.
A break below 1.1005 would likely confirm resumption of the broader downtrend, potentially targeting 1.0950 and beyond depending on the momentum structure.
Moving Averages and Dynamic Price Action
EUR/USD continues to trade below both the 50-period and 200-period weighted moving averages, which remain negatively sloped. The 200-WMA, in particular, is acting as a ceiling and technical reference point for trend-following systems. Price failed to reclaim this average on three separate rallies, reinforcing its relevance. The 50-WMA, while attempting to flatten, lacks slope and provides little directional guidance at this stage — serving more as confirmation of neutral-to-bearish bias.
Only a sustained close above both moving averages, particularly with a clean candle structure and follow-through, would shift market perception away from corrective to potential trend reversal. Until then, all rallies into this area are technically viewed as retracement tests within a broader downtrend.
RSI Momentum and Bullish Pressure
The 14-period RSI has staged a modest recovery, rising from near 30 to the 55–57 region, reflecting the recent bounce but failing to generate sufficient strength to confirm a true reversal. The indicator is flattening below the 60 level — historically a zone of resistance in corrective rallies. Without a breakout above this threshold, momentum remains capped and vulnerable to renewed selling.
Importantly, no bullish divergence has emerged, and RSI’s failure to break into strong bullish territory reinforces the view that this bounce remains corrective. Should the indicator turn lower and break back below 50, that would reinforce momentum alignment with price and likely coincide with a push below 1.1065.
Candlestick Behavior and Price Action Clarity
Candlestick structure over the past few sessions has turned indecisive and choppy, with upper shadows developing around 1.1116 and bodies becoming increasingly narrow. This price behavior often precedes rejection, especially when combined with waning RSI and macro headwinds.
No bullish engulfing candles or reversal patterns such as morning stars or pin bars have emerged near support zones, and the current series reflects supply-driven hesitation rather than demand-led accumulation. The lack of follow-through after intraday upside attempts further supports the idea that bulls lack conviction at this stage.
Chart Structure and Breakdown Formation
The current formation on the H1/H4 chart suggests a bearish retracement leg within a dominant downtrend. Price action from 1.1381 to 1.1065 formed a clean impulse move to the downside, while the recent bounce into 1.1116 resembles a three-wave correction — potentially a textbook ABC pattern within Elliott wave terms.
The failure to form higher highs or breach the 1.1133 neckline keeps the broader trend intact. This structure remains vulnerable to a breakdown toward the base of the retracement range, especially if no bullish continuation occurs in the next few sessions.
Fibonacci Retracement and Extension Levels
The Fibonacci retracement mapped from 1.1381 to 1.1065 remains the dominant technical framework. After stalling at the 78.6% retracement at 1.1116, price has failed to test the 61.8% at 1.1186, indicating insufficient bullish pressure to complete a meaningful correction. The 50% level at 1.1223 remains theoretical at this point, only valid if 1.1133 is cleared.
To the downside, a move through 1.1065 would open the door to 1.1050 and 1.1005, followed by a full retracement toward the 1.0950 extension zone, which aligns with the 1.618 Fibonacci projection of the latest corrective wave. Until key resistance levels are broken, Fibonacci structure continues to favor a reversion to trend.
🔍 MARKET OUTLOOK & TRADING SCENARIOS
Bullish Scenario
If price breaks and closes above 1.1116, with RSI pushing through 60, buyers may regain short-term control. A clean move toward 1.1133 would open the path for a possible extension to 1.1186, where the 61.8% Fib and 200-WMA converge. Volume confirmation and strong candle structure are essential for validating this path.
Neutral Scenario
A continuation of current range behavior between 1.1065 and 1.1116 suggests indecision. RSI holding in the 50–55 corridor confirms temporary equilibrium. Traders would wait for breakout cues and confirmation before engaging directional strategies.
Bearish Scenario
A rejection at 1.1116 followed by a close below 1.1065 would resume the bearish cycle. RSI rolling below 50 would provide momentum confirmation. In this case, 1.1050 and 1.1005 become active targets, with potential for trend extension toward 1.0950.
💼 TRADING CONSIDERATIONS
Traders with bearish bias may look for entry signals near the 1.1116–1.1133 resistance zone, using tight risk controls and clear confirmation on volume and candle structure. Bullish setups require not just a break above 1.1116, but also continued strength through the 200-WMA, ideally with RSI confirming over 60. Until those occur, intraday rallies are likely to be sold into.
🏁 CONCLUSION
EUR/USD has recovered from recent lows but remains technically capped beneath the 1.1116 Fibonacci resistance, with RSI stalling and both major moving averages overhead. Unless bulls can reclaim 1.1133–1.1186, the structure remains bearish, and recent gains appear corrective. Price now sits at a technical pivot — either reclaiming control or rolling back into trend continuation.
⚠️ DISCLAIMER
This analysis is for informational purposes only and does not constitute financial advice. Always consult with a licensed financial professional before making trading decisions.


