
📊 MARKET OVERVIEW
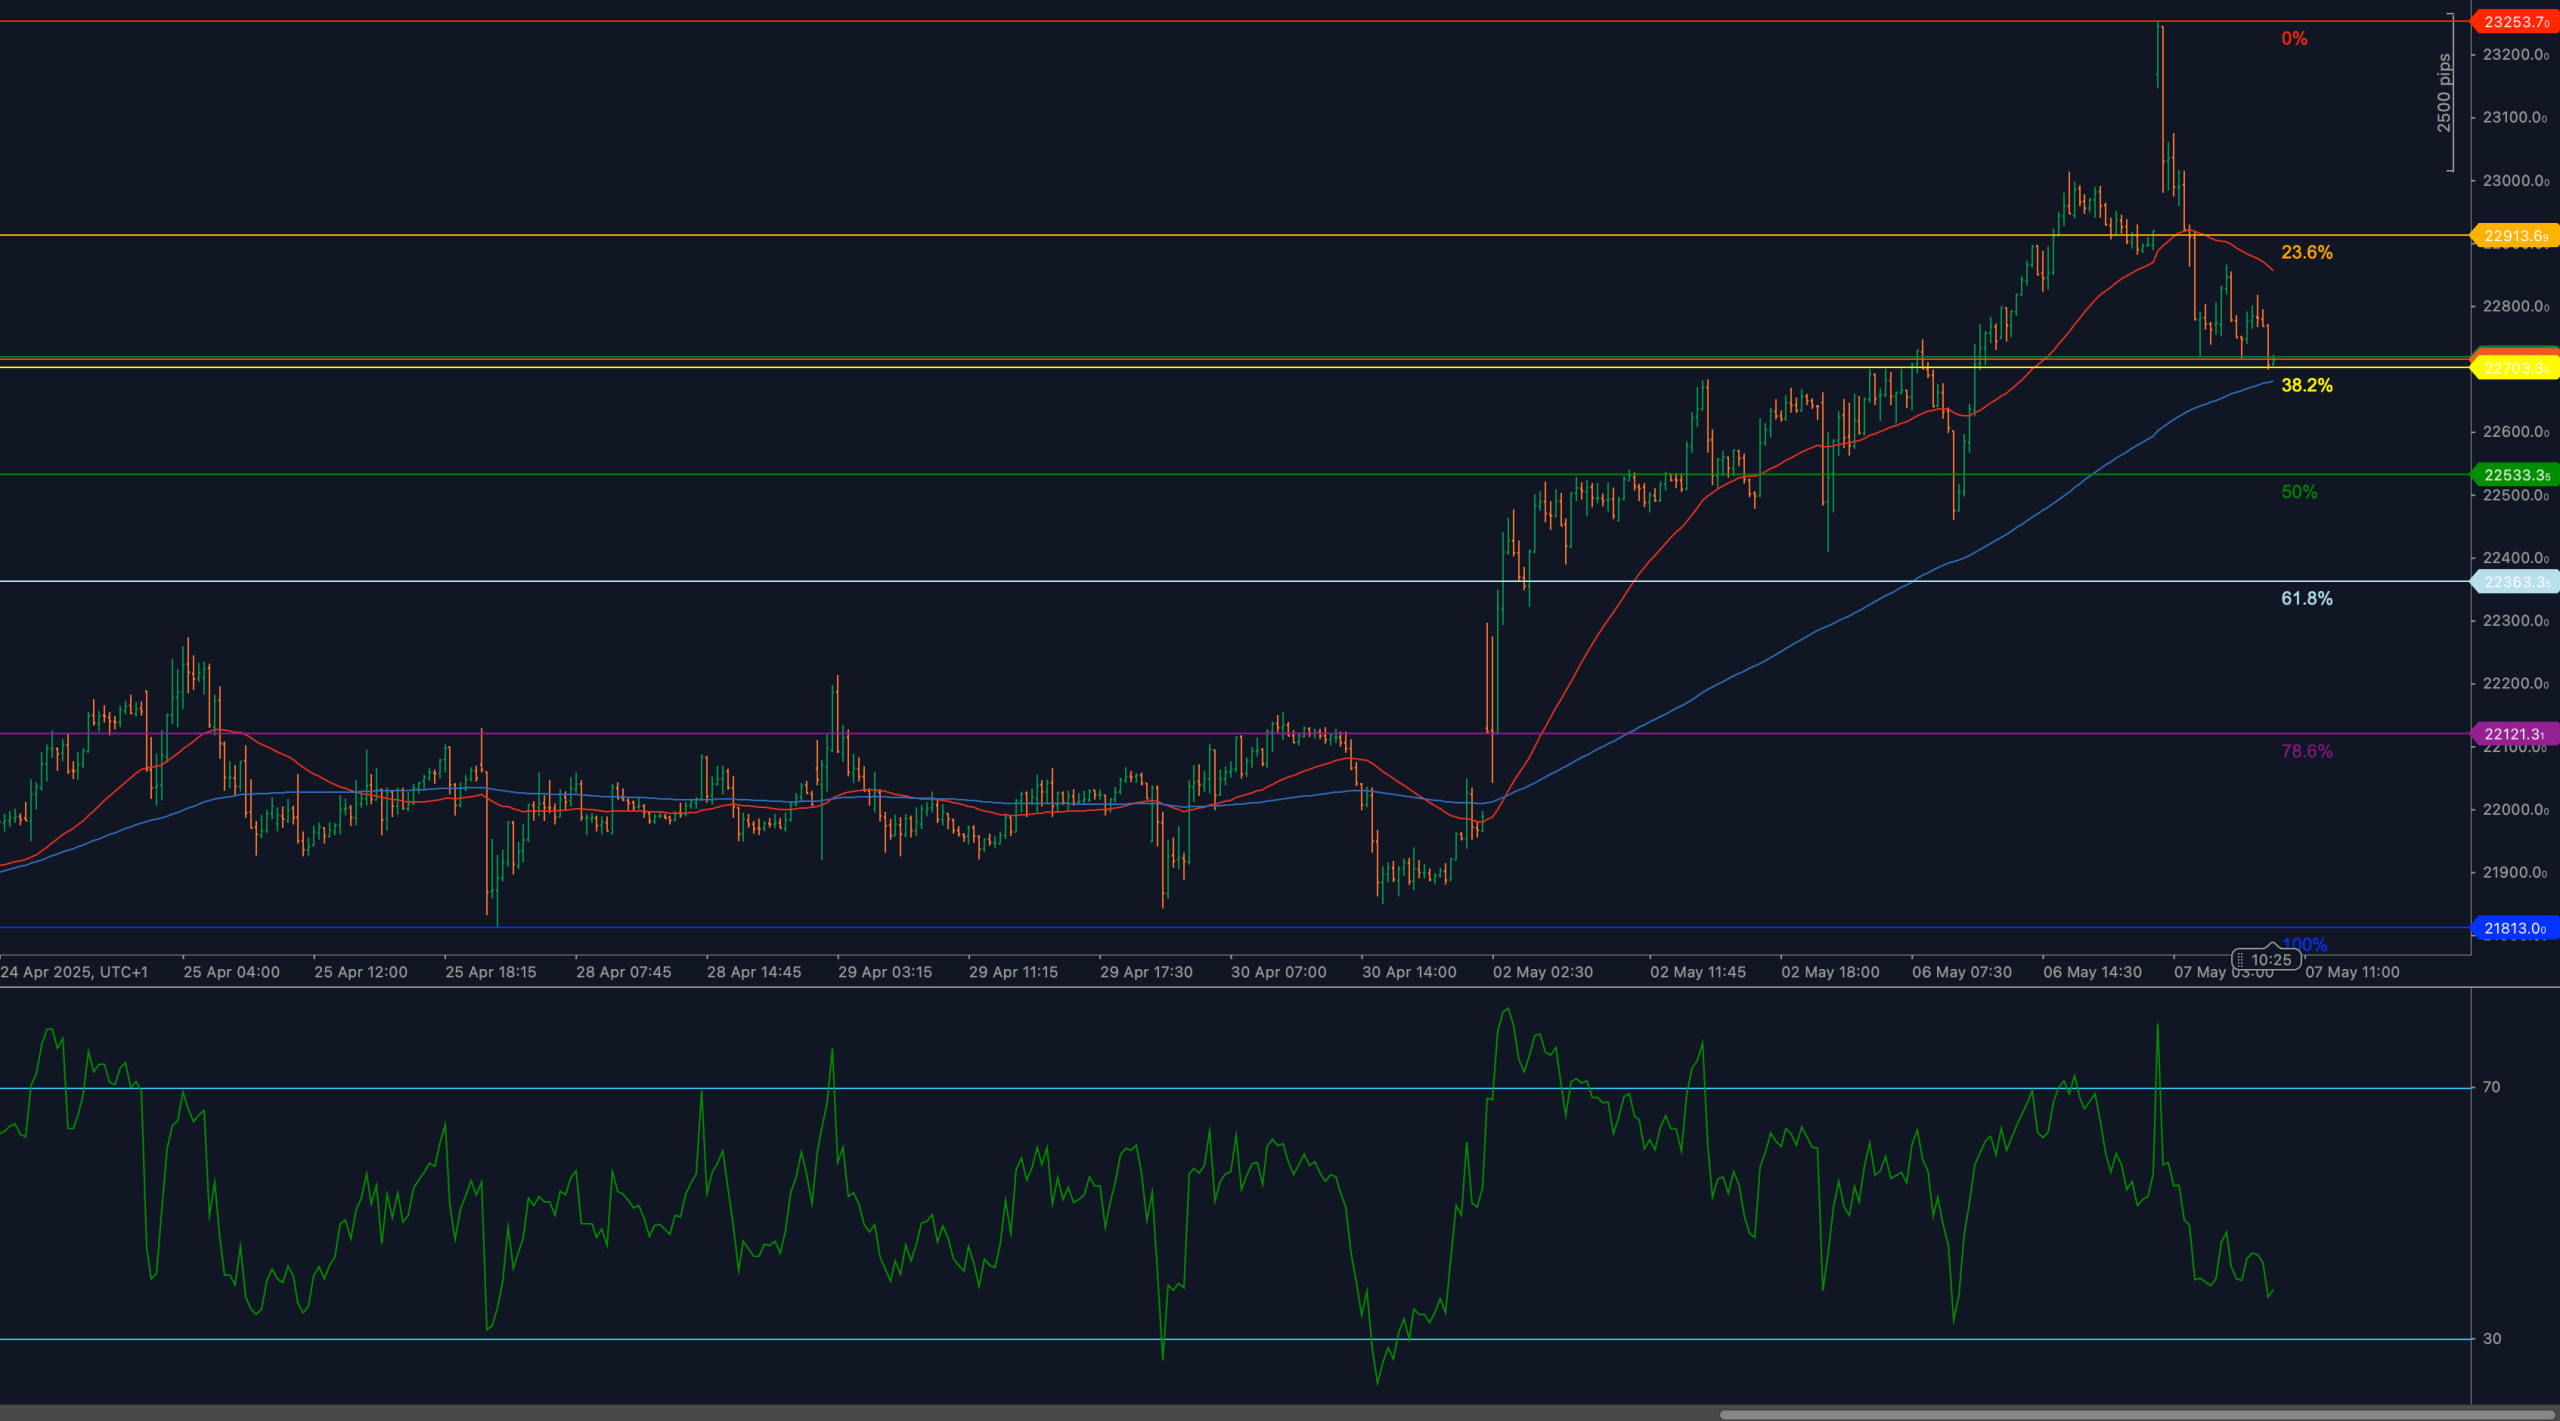
The Hang Seng Index (HSI50) has lost bullish structure after failing to sustain the breakout above 22918.6, the 23.6% Fibonacci retracement drawn from the April 24 low at 21813.0 to the May 6 high at 23258.7. Price action has since reversed sharply, with the index now trading around 22715.5, which marks the 38.2% retracement and the next pivotal support zone. The drop has coincided with a clear rollover in RSI, as momentum fades from overbought conditions.
Global equities have shown mixed performance, and the Hang Seng appears to be entering a correction phase after an aggressive impulse leg. Unless the current support at 22715 holds, the market may be setting up for a deeper retracement toward mid-Fibonacci levels. Risk appetite is weakening, and price has started to interact with major moving averages in a way that suggests increased technical vulnerability.
📈 TECHNICAL ANALYSIS
Key Support and Resistance Levels
The key upside level remains 22918.6, the 23.6% retracement, which price failed to hold during the latest pullback. This area now flips into resistance. Immediate support rests at 22715.5, which is the 38.2% Fibonacci retracement — a critical line that separates shallow retracement from more aggressive correction. If this level breaks, the next downside targets become 22533.5 at the 50% retracement, and 22305.3, aligned with the 61.8% retracement. A breakdown through these layers would expose 22121.3 and potentially 21813.0, the full retracement low.
Moving Averages and Dynamic Price Action
HSI50 is currently trading below the 50-period WMA, which has started to roll over, and is testing the 200-period WMA. This is a technical warning sign, suggesting a shift from trend continuation to mean reversion or broader correction. The failure to hold above the 50-WMA has triggered short-term selling pressure, and the 200-WMA is now acting as the final dynamic support. A close below both averages would confirm structural breakdown and likely attract more downside positioning.
RSI Momentum and Bearish Pressure
The 14-period RSI has collapsed from overbought territory and is now testing the 40 level, suggesting growing bearish momentum. There is no divergence at play, but the velocity of the drop reflects the sharp price rejection at 22918. Should the RSI fall below 35, this would support a breakdown narrative and validate the bearish continuation case. Until a reversal pattern or RSI divergence emerges, momentum favors further downside.
Candlestick Behavior and Price Action Clarity
Recent candlesticks highlight rejection and weakness. The last bullish impulse was followed by strong-bodied bearish candles and minimal bounce attempts. The failure to sustain above 22918 triggered immediate selling pressure, and candles since have shown no lower wicks — a sign of persistent sell-side aggression. Price is pressing directly into support without building a base, which increases the risk of breakdown.
Chart Structure and Breakdown Formation
The chart now reflects a reversal structure after a vertical rise into 23258.7, followed by lower highs and lower closes. The failure at 22918 resembles a right shoulder formation in a rounding top structure. If 22715 fails, the bearish momentum is likely to accelerate toward deeper retracement zones. Only a reclaim of 22918 with strong candle confirmation would negate the bearish sequence. Until then, the structure favors correction rather than consolidation.
Fibonacci Retracement and Extension Levels
The Fibonacci retracement from 21813.0 to 23258.7 defines a high-to-low range of 1445.7 points. Price has already broken below the 23.6% level at 22918.6 and is testing the 38.2% level at 22715.5. If this zone is lost, bears will likely target 22533.5 (50% retracement) and 22305.3 (61.8%), both of which represent major reaction levels in prior trends. A full corrective phase would open the door to the 78.6% retracement at 22121.3 or even the 100% retracement at 21813.0. Unless 22918 is reclaimed swiftly, the Fibonacci grid favors a continued retracement bias.
🔍 MARKET OUTLOOK & TRADING SCENARIOS
Bullish Scenario
If price rebounds sharply from 22715 and RSI reclaims 50+, a recovery toward 22918 becomes plausible. A break above this level would neutralize bearish pressure and reopen the path toward 23200+. Until then, bullish setups remain speculative and require confirmation.
Neutral Scenario
Price holds between 22715 and 22918, creating a range as traders assess direction. RSI stabilizes around 45–50 and volume fades. This scenario implies sideways digestion before trend resolution.
Bearish Scenario
A close below 22715.5 supported by RSI beneath 40 would open room for a leg down toward 22533, followed by 22305 and possibly 22121. If momentum intensifies, a full retracement to 21813 cannot be ruled out.
💼 TRADING CONSIDERATIONS
Short sellers may look to engage on clean breaks below 22715, with targets at 22533 and 22305. Bullish setups require confirmation via strong RSI rebound and price closing above 22918. Until structure improves, tactical shorts with tight risk controls are favored around current levels.
🏁 CONCLUSION
HSI50 has broken down from 22918.6 and now tests the 38.2% retracement at 22715.5, with momentum and price structure turning clearly bearish. RSI weakness and price rejection support further downside unless immediate support holds. All eyes now turn to whether 22715 will serve as a bounce zone — or the trigger for deeper correction into the 22500–22100 range.
⚠️ DISCLAIMER
This analysis is for informational purposes only and does not constitute financial advice. Always consult with a licensed financial professional before making trading decisions.


