
📊 MARKET OVERVIEW
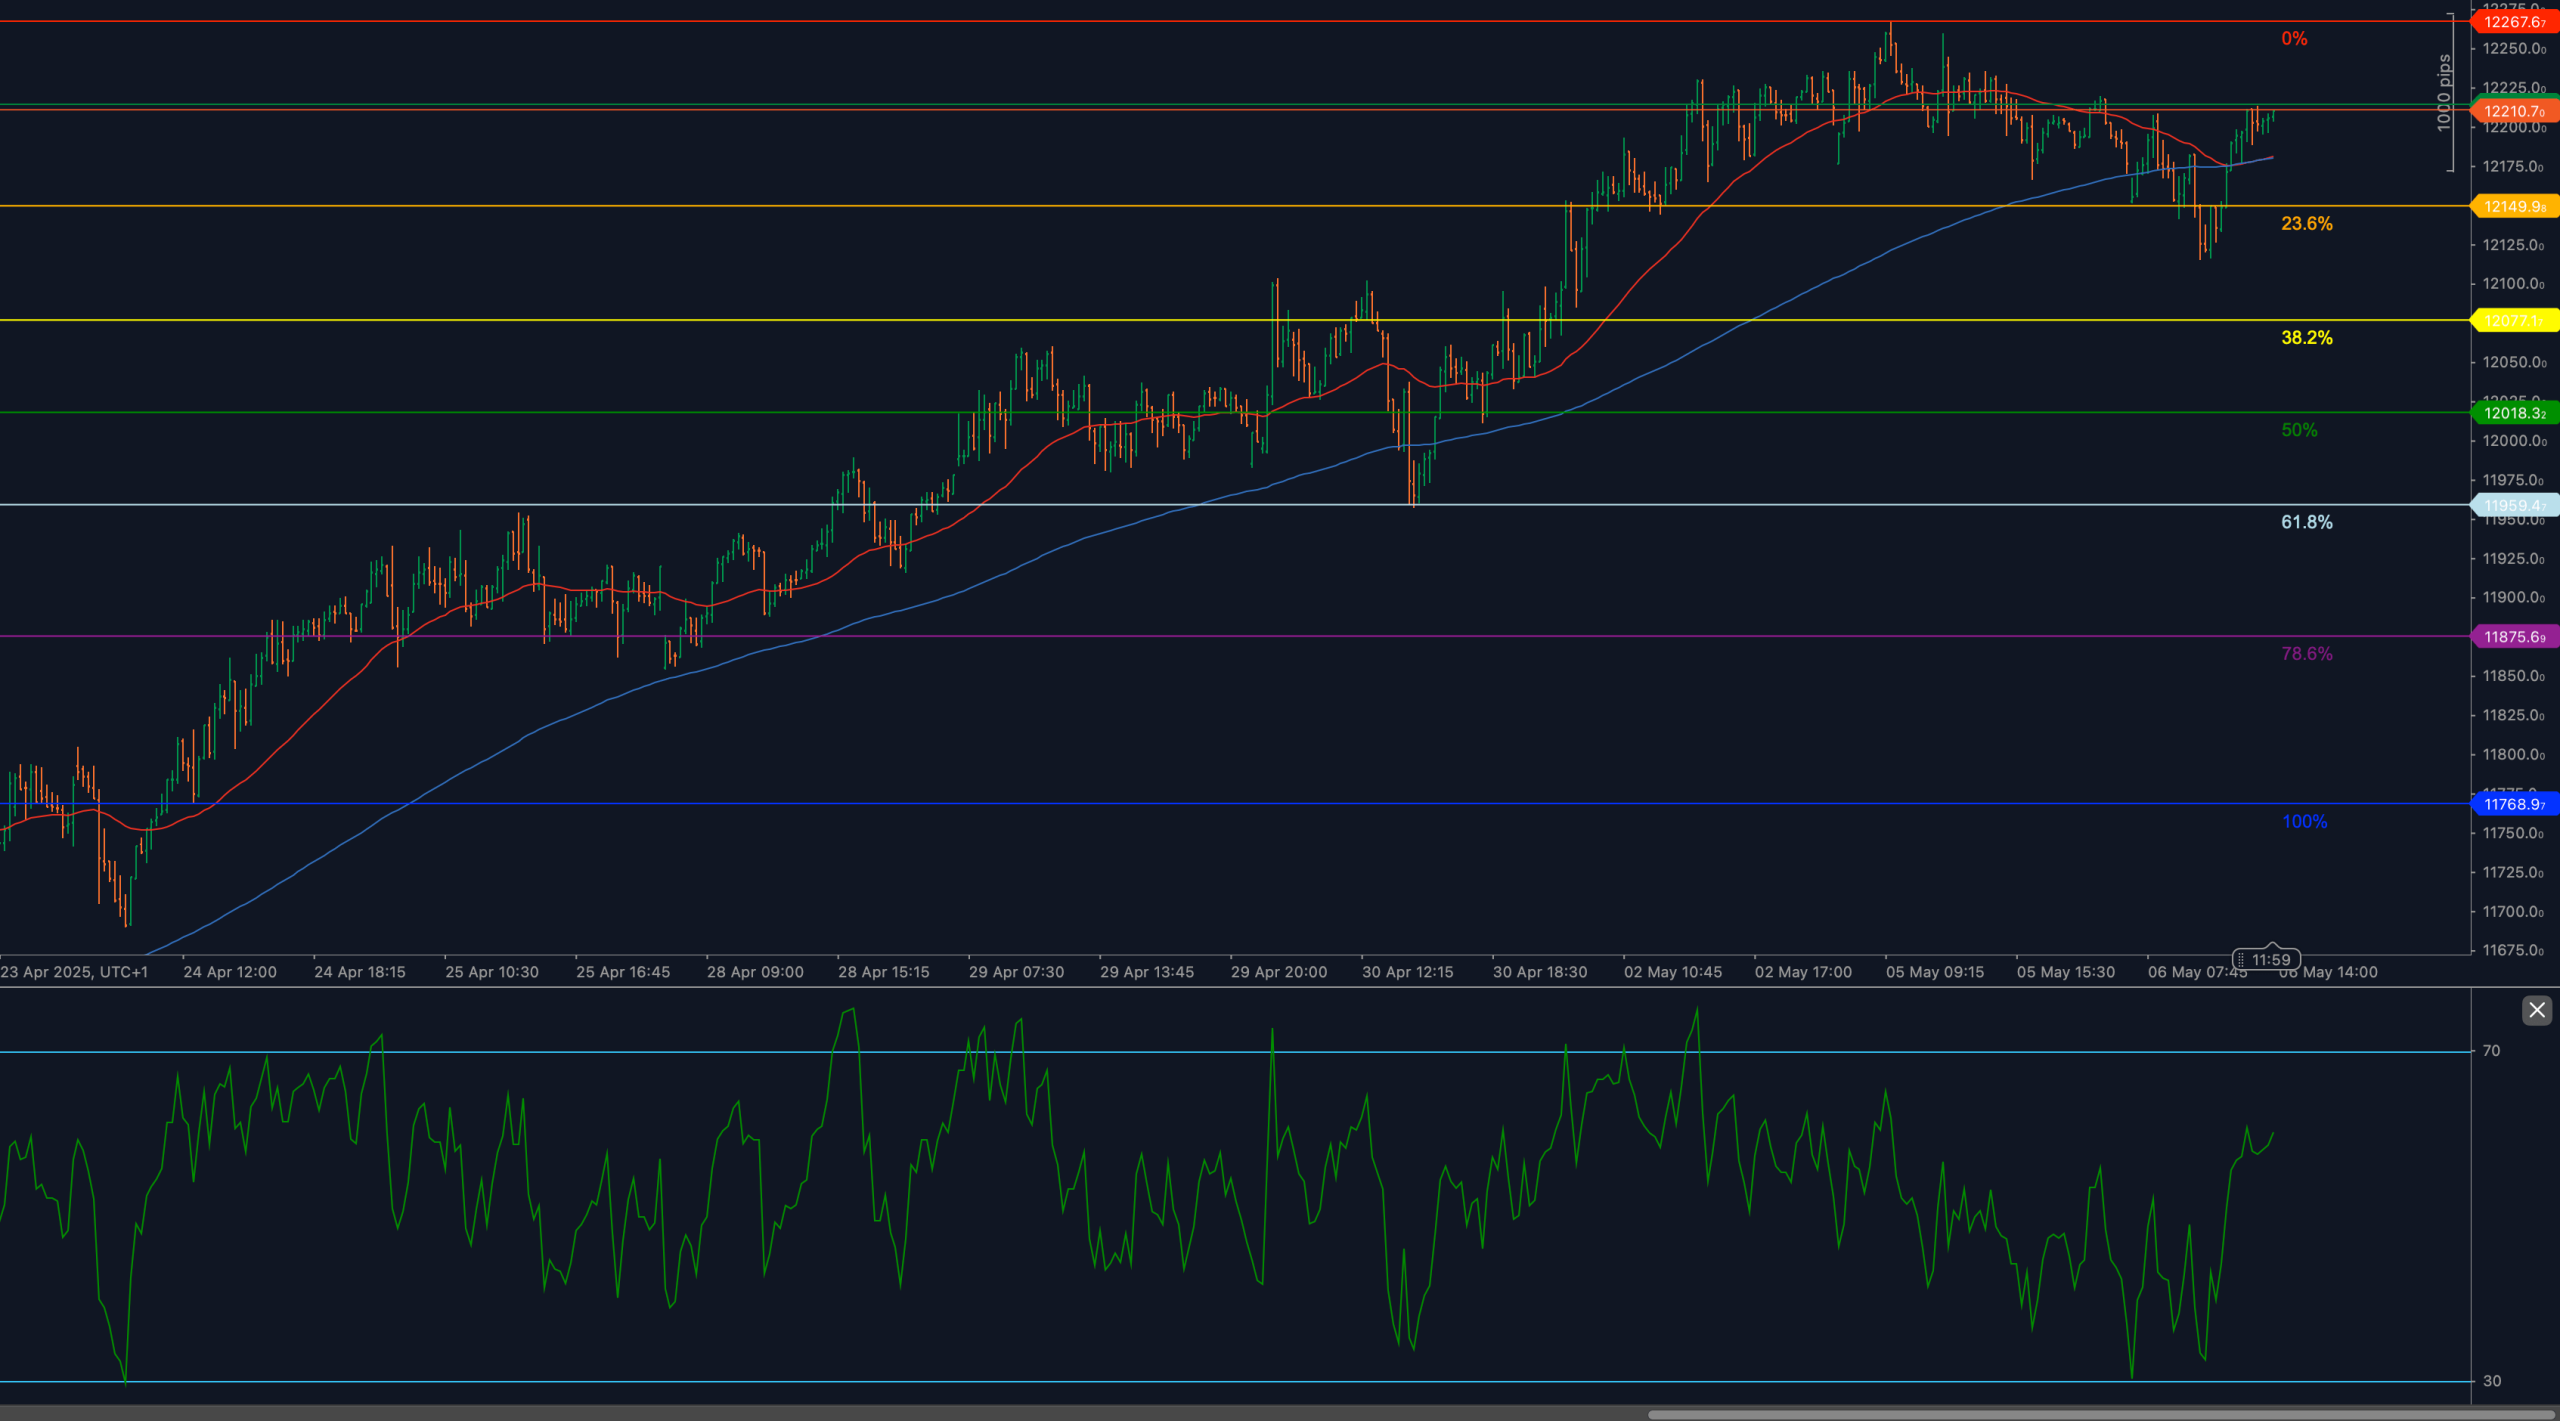
The Swiss SMI20 index has found stability above the 23.6% Fibonacci retracement at 12149.9 following a pullback from its April 30 peak at 12267.6. Price action shows early signs of recovery as RSI bounces off oversold territory and momentum shifts cautiously higher. The broader equity tone in Europe has remained mixed, but buyers appear to be reasserting control after defending the 12149 pivot.
While the recent correction from the high challenged short-term bullish momentum, the index avoided a deeper collapse into mid-range Fibonacci territory. With price now retesting broken structure and holding above the 200-WMA, traders are closely watching whether SMI20 can retake 12267.6 to confirm a full trend resumption.
📈 TECHNICAL ANALYSIS
Key Support and Resistance Levels
The first resistance remains the recent swing high at 12267.6, which marks the top of the previous impulse. A break above this level would shift the structure toward bullish extension and potentially open room for new highs. Immediate support now lies at 12149.9, the 23.6% Fibonacci retracement, which price reclaimed after a short dip. If bearish pressure returns, the next critical downside levels are 12018.3, aligned with the 38.2% retracement, and 11959.4, the 50% retracement level. Both zones are essential for trend preservation. A break below them would change the tone toward a deeper correction.
Moving Averages and Dynamic Price Action
Price is beginning to recover above both the 50-period and 200-period weighted moving averages, after briefly trading below them. The 50-WMA is beginning to flatten, while the 200-WMA continues to hold steady, reinforcing medium-term structural support. A clean reclaim of both would signal buyers regaining trend control. For now, the recovery above the moving averages signals a shift from neutral to cautiously bullish posture, as long as 12149 continues to hold as support.
RSI Momentum and Bullish Pressure
The 14-period RSI has rebounded strongly off oversold territory, now moving into the 55 region and indicating renewed buying interest. This bounce from a deeply compressed RSI zone marks a momentum shift, though confirmation still requires further price strength above 12200. If RSI reclaims the 60–65 band, it would provide added conviction to the breakout attempt. A reversal back below 50 would suggest failed recovery and reintroduce downside bias.
Candlestick Behavior and Price Action Clarity
Recent candlesticks show clear rejection of lower levels, with strong-bodied bullish candles and fading selling tails. The zone between 12000 and 12150 provided consistent intraday demand, supporting the bullish pivot. There are no bearish engulfing patterns or reversal formations currently visible, and price continues to respect the reclaimed Fibonacci level. A close above 12200 would confirm bullish follow-through and position the index for a test of the highs.
Chart Structure and Breakout Formation
The broader structure shows a typical retracement and stabilization after a strong prior trend. The correction into the 23.6–38.2% Fibonacci zone was shallow compared to the depth of the previous advance, and price is now rebounding in what may become a continuation pattern. The moving average behavior and RSI recovery support the view that price is rebuilding for a breakout. Confirmation above 12267.6 would mark a return to the prior trend path. A failure here, however, risks range consolidation or retest of mid-fib zones.
Fibonacci Retracement and Extension Levels
The Fibonacci retracement drawn from 11768.9 to 12267.6 creates a clear structure of support and risk. The 23.6% level at 12149.9 has already proven technically significant, serving as a base for the current recovery. The 38.2% level at 12018.3 remains the next downside inflection, often acting as a buyer re-entry point in strong trends. The 50% retracement at 11959.4 is more neutral but crucial for maintaining medium-term structure. A move toward the 61.8% level at 11895.4 or lower would suggest trend failure. On the upside, a break above 12267.6 activates Fibonacci extension sequences, targeting expansion levels above the previous high.
🔍 MARKET OUTLOOK & TRADING SCENARIOS
Bullish Scenario
If price continues to hold above 12149 and breaks above 12267.6, the trend reasserts, with RSI strength supporting a momentum extension. Breakout confirmation may target Fibonacci expansions above the April peak, and intraday dips into 12150–12200 would remain structurally constructive.
Neutral Scenario
Sideways movement between 12149 and 12267.6 would suggest the index is building a base. RSI holding in the 50–60 range would reinforce this view. In this case, market bias stays balanced unless broken by strong volume or trend confirmation.
Bearish Scenario
A close below 12149.9, especially if followed by breakdown through 12018.3 and 11959.4, would turn the outlook bearish. RSI slipping under 45 would signal momentum loss. A deeper move toward 11895 or below would reflect full retracement pressure.
💼 TRADING CONSIDERATIONS
Bullish positioning favors long entries on dips near 12149 or breakouts above 12267. Risk is defined below 12018 with targets at the prior high and above. Bearish setups only gain traction on confirmed rejection of 12267 and clean breaks through 11959. Traders should manage exposure as volatility rises near these key pivot zones.
🏁 CONCLUSION
SMI20 has reclaimed the 12149 Fibonacci level and is rebuilding above both major moving averages. With RSI recovering and no bearish reversal signals in place, the bullish case gains traction. Price must now confirm strength through 12267.6 to validate a breakout. Unless support breaks decisively, the technical map favors trend continuation.
⚠️ DISCLAIMER
This analysis is for informational purposes only and does not constitute financial advice. Always consult with a licensed financial professional before making trading decisions.


