
📊 MARKET OVERVIEW
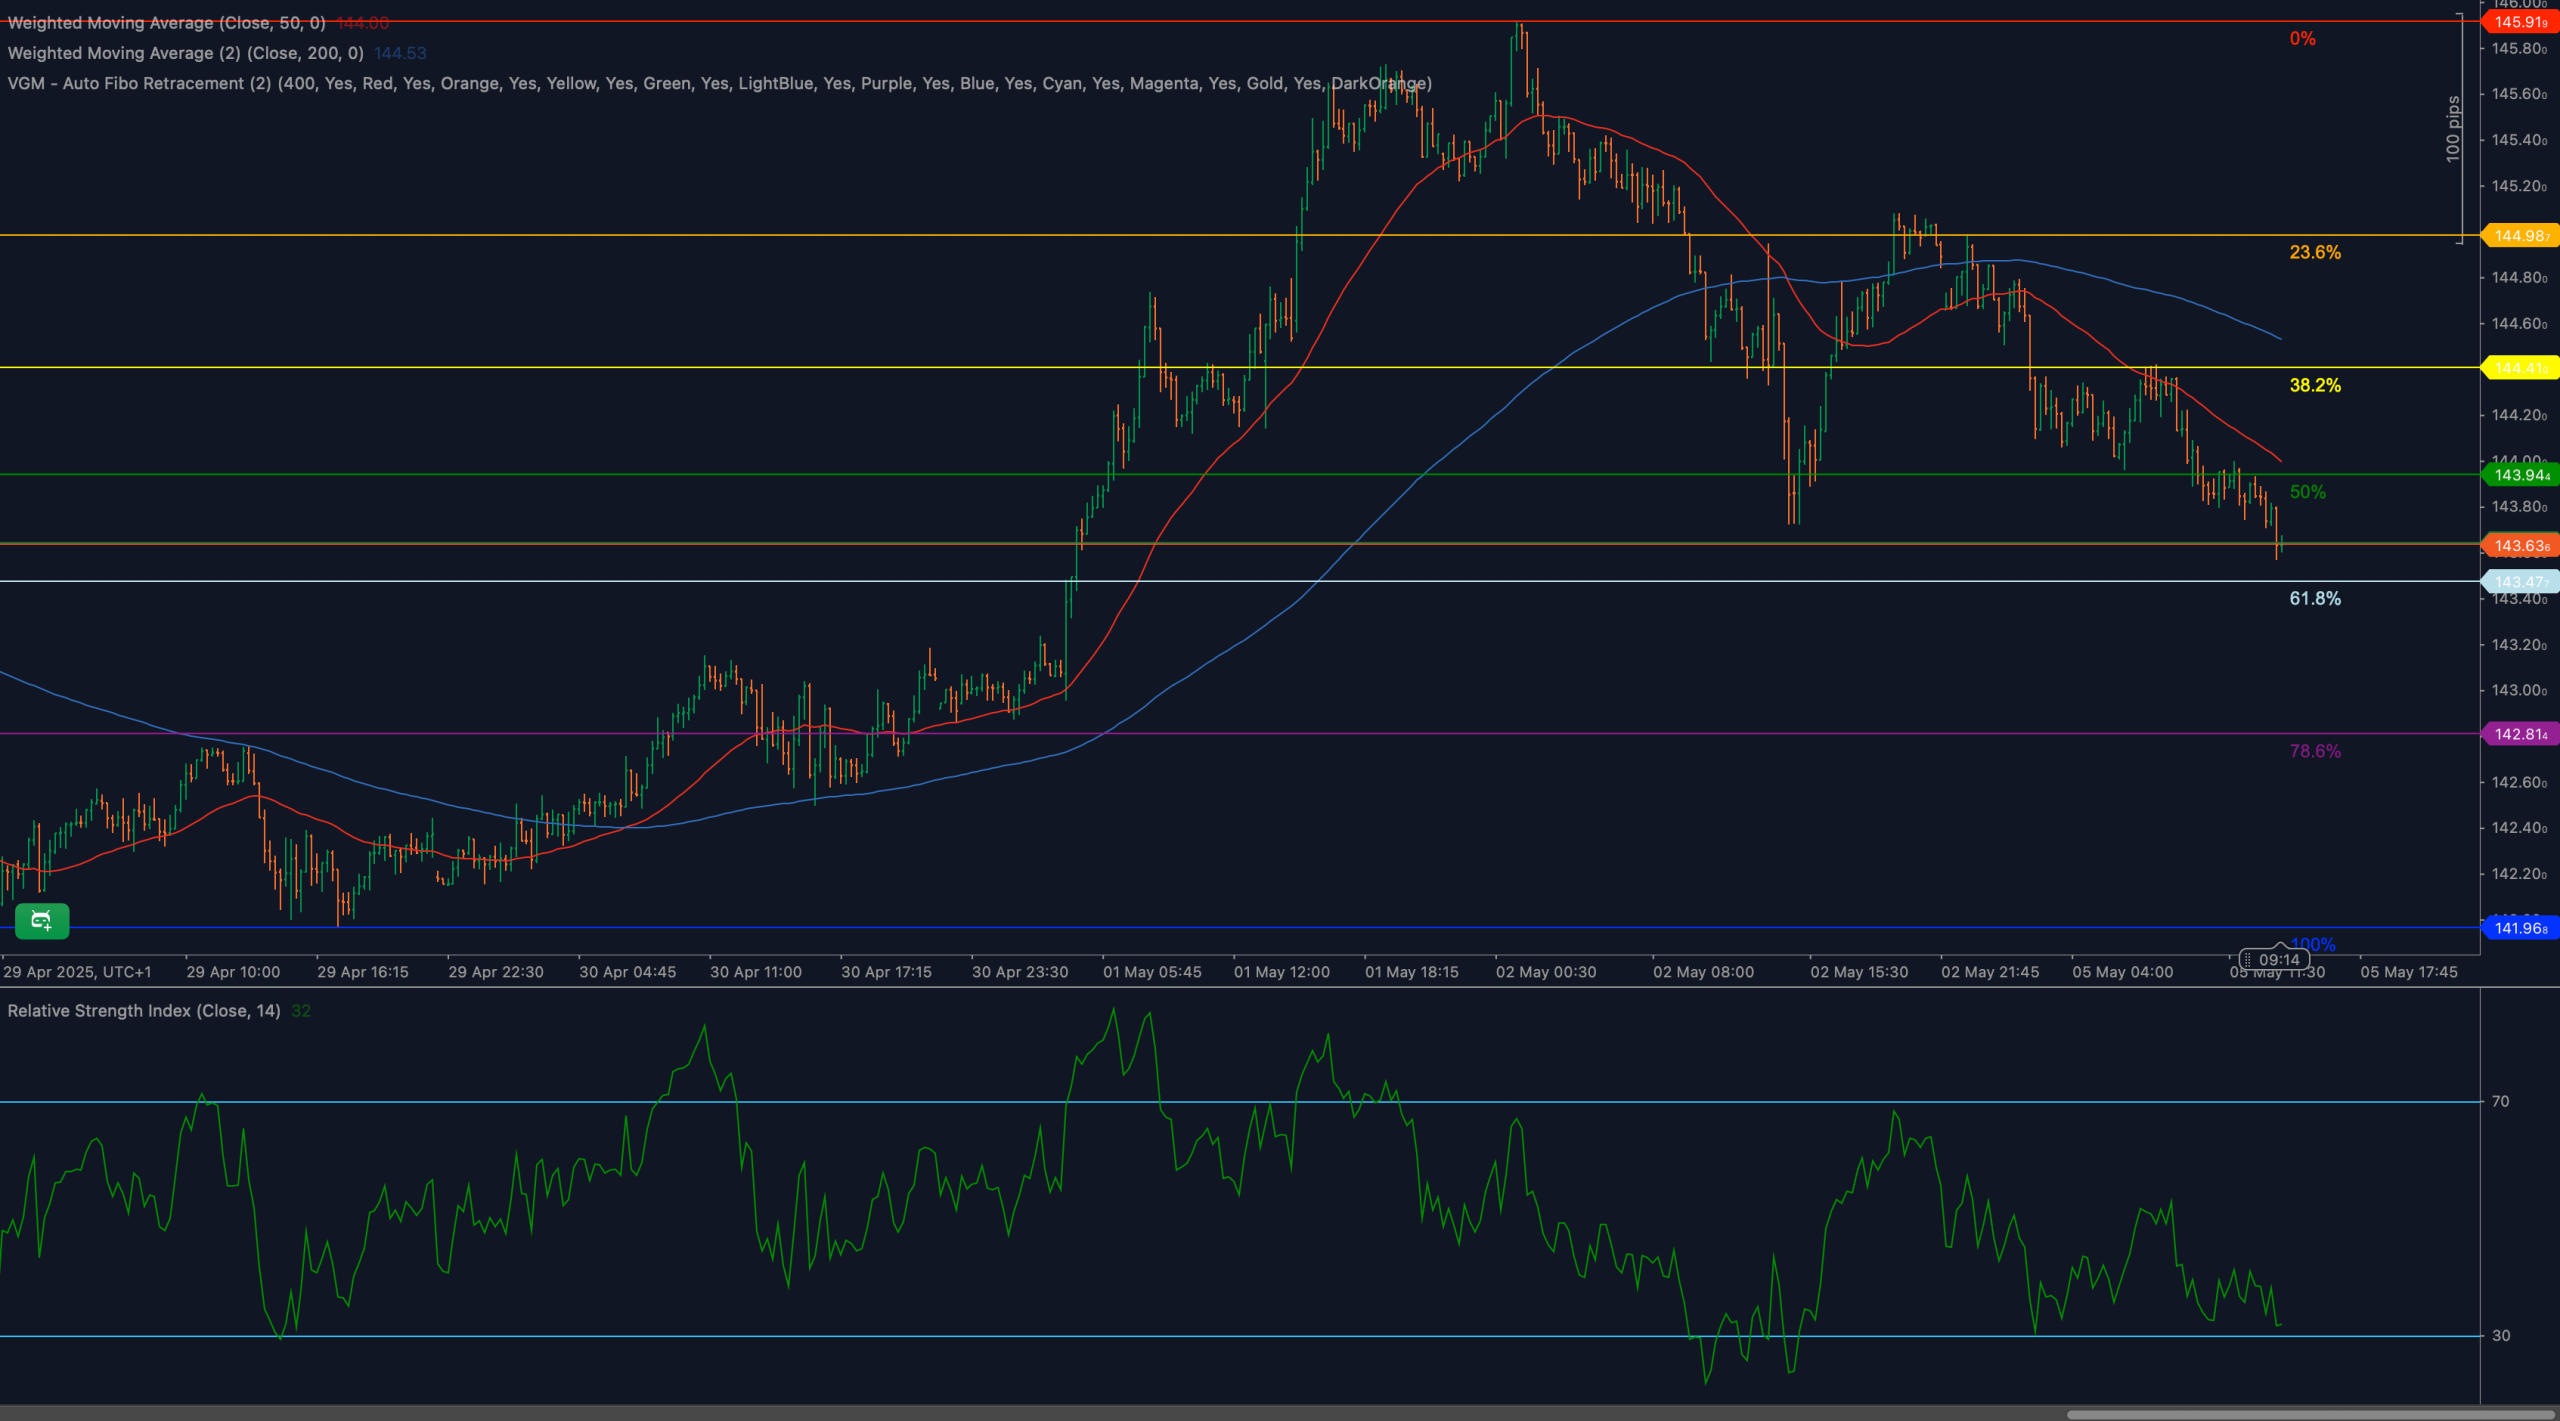
USD/JPY has shifted into corrective mode, slipping firmly below the critical 143.63 region — a level that coincides with the 61.8% Fibonacci retracement from the April 29 low at 141.96 to the May 1 peak at 145.91. After a sharp rally fueled by dollar strength and U.S. rate expectations, momentum has flipped lower as bond yields cool and the yen regains some safe-haven traction.
The break beneath 143.63 signals a key structural change in the trend. While the longer-term uptrend may still be intact, the short-term profile has clearly turned bearish. Moving averages are now rolling over, RSI is approaching oversold levels, and recent candlestick patterns confirm bearish commitment.
Price is now pressing into the final stages of the Fibonacci retracement framework. Traders must now assess whether deeper supports such as 142.81 or even 141.96 will provide a reaction, or whether the broader structure is unwinding more decisively.
📈 TECHNICAL ANALYSIS
Key Support and Resistance Levels
The immediate support level at 143.63 — the 61.8% Fibonacci retracement — has been decisively broken. This opens the door to the next downside targets: 142.81 (78.6% retracement) and the 141.96 swing low, which represents a full retracement of the recent rally.
On the upside, the broken 143.63 level now becomes initial resistance. Above that, 143.94 (50% Fib) and 144.41(38.2% Fib) mark secondary resistance zones. A sustained recovery above 144.90 would be needed to neutralize current bearish pressure.
Moving Averages and Dynamic Price Action
USD/JPY has moved beneath both the 50-period and 200-period Weighted Moving Averages, signaling a loss of bullish control. The 50-WMA has turned downward, and while the 200-WMA remains relatively flat, its role as support has now been invalidated.
This cross below both WMAs is a key technical signal, especially as they had previously provided bullish structure. Unless price quickly recovers back above 144.00–144.30, the risk of trend continuation to the downside remains elevated.
RSI Momentum and Bearish Pressure
The 14-period RSI has dropped aggressively, now hovering near 32, just above the oversold threshold. The speed of the RSI decline mirrors price action and confirms accelerating downside momentum.
At this stage, no bullish divergence is visible. If RSI dips below 30 without forming a reversal structure, the signal would support further bearish continuation. Only a strong RSI rebound with price reclaiming broken Fib levels would mark potential exhaustion.
Candlestick Behavior and Price Action Clarity
Recent candlesticks show increasingly dominant bearish control. Long-bodied red candles with shallow lower wicks demonstrate minimal support reaction. The break of 143.63 came on a decisive candle close, adding technical weight to the move.
The current sequence does not show reversal traits such as pin bars, hammer formations, or bullish engulfing patterns. For sentiment to shift, price would need to reclaim 143.63 with a large bullish candle supported by higher volume.
Chart Structure and Breakdown Formation
The overall pattern on the chart resembles a rounded top, or rolling exhaustion formation. After peaking at 145.91, price failed to sustain higher and formed a series of lower highs. The neckline at 143.63 marked the technical boundary between correction and deeper breakdown — and that line has now been breached.
Unless a swift reclaim occurs, price may now be forming a descending path targeting the full retracement leg. The breakdown structure is aligned with bearish continuation patterns unless a significant reversal emerges soon.
Fibonacci Retracement and Extension Levels
The Fibonacci retracement and extension grid mapped from 141.96 (April swing low) to 145.91 (May high) provides essential structure for understanding current and potential price behavior.
The 61.8% retracement, located at 143.63, was the final major level often associated with bullish continuation. Its failure suggests a clear shift in sentiment. Price has now entered the final stages of the retracement structure.
The 78.6% retracement, at 142.81, is the next critical level. This is a deep pullback zone often watched for bargain buying or last-line defense in a trend. A reaction here is possible, but any sustained trade beneath this zone opens the path to a full 100% retracement at 141.96.
The 50% retracement, near 143.94, may act as a technical magnet if a bounce does materialize, but until price recovers above this midpoint, the structure remains bearish.
Each Fibonacci level now plays a dual role — first as a support/resistance barrier, and second as a market sentiment gauge. The recent breakdown below 143.63 tilts bias toward continued retracement, with traders now watching 142.81 and 141.96 as potential next stops.
If price finds support at 142.81 and stabilizes, the broader trend could still reassert itself. However, a close below 141.96 would constitute a full unwind of the rally and force reevaluation of the medium-term outlook.
🔍 MARKET OUTLOOK & TRADING SCENARIOS
Bullish Scenario
If price stabilizes near 142.81 and RSI rebounds above 40, a recovery could unfold toward 143.63 and the midpoint zone around 143.94. Reclaiming both moving averages would be a bullish technical confirmation. A break above 144.41 would open the door for a retest of 145.00+.
Neutral Scenario
A pause in volatility between 142.81 and 143.63 would signal a consolidation range as the market digests recent losses. This could lead to a base-building scenario or an eventual continuation breakdown. RSI hovering between 35–45 would support this view.
Bearish Scenario
If 142.81 fails to hold and price breaks lower toward 141.96, bearish momentum will intensify. This move would complete the retracement leg and shift focus to the potential formation of a broader downtrend. RSI beneath 30 would confirm extended downside pressure.
💼 TRADING CONSIDERATIONS
- Bullish setup: Buy reversal signals at 142.81 with initial targets at 143.63 and 143.94. Stop-loss below 141.90.
- Bearish setup: Short on confirmed breakdown below 142.81, targeting 141.96. Add exposure on failed retests of 143.63.
- Volatility may increase around these key retracement thresholds — use tight, structured risk management and monitor RSI for confirmation.
🏁 CONCLUSION
USD/JPY has breached a critical support zone at 143.63, confirming a shift from bullish correction to active bearish structure. With RSI nearing oversold and price action accelerating, the 142.81 and 141.96 Fibonacci levels are now in play. Unless a swift recovery materializes, the path of least resistance remains to the downside. Traders should monitor reaction behavior near these support zones to determine whether this is a correction or a broader reversal unfolding.
⚠️ DISCLAIMER
This analysis is for informational purposes only and does not constitute financial advice. Always consult with a licensed financial professional before making trading decisions.


