
📊 MARKET OVERVIEW
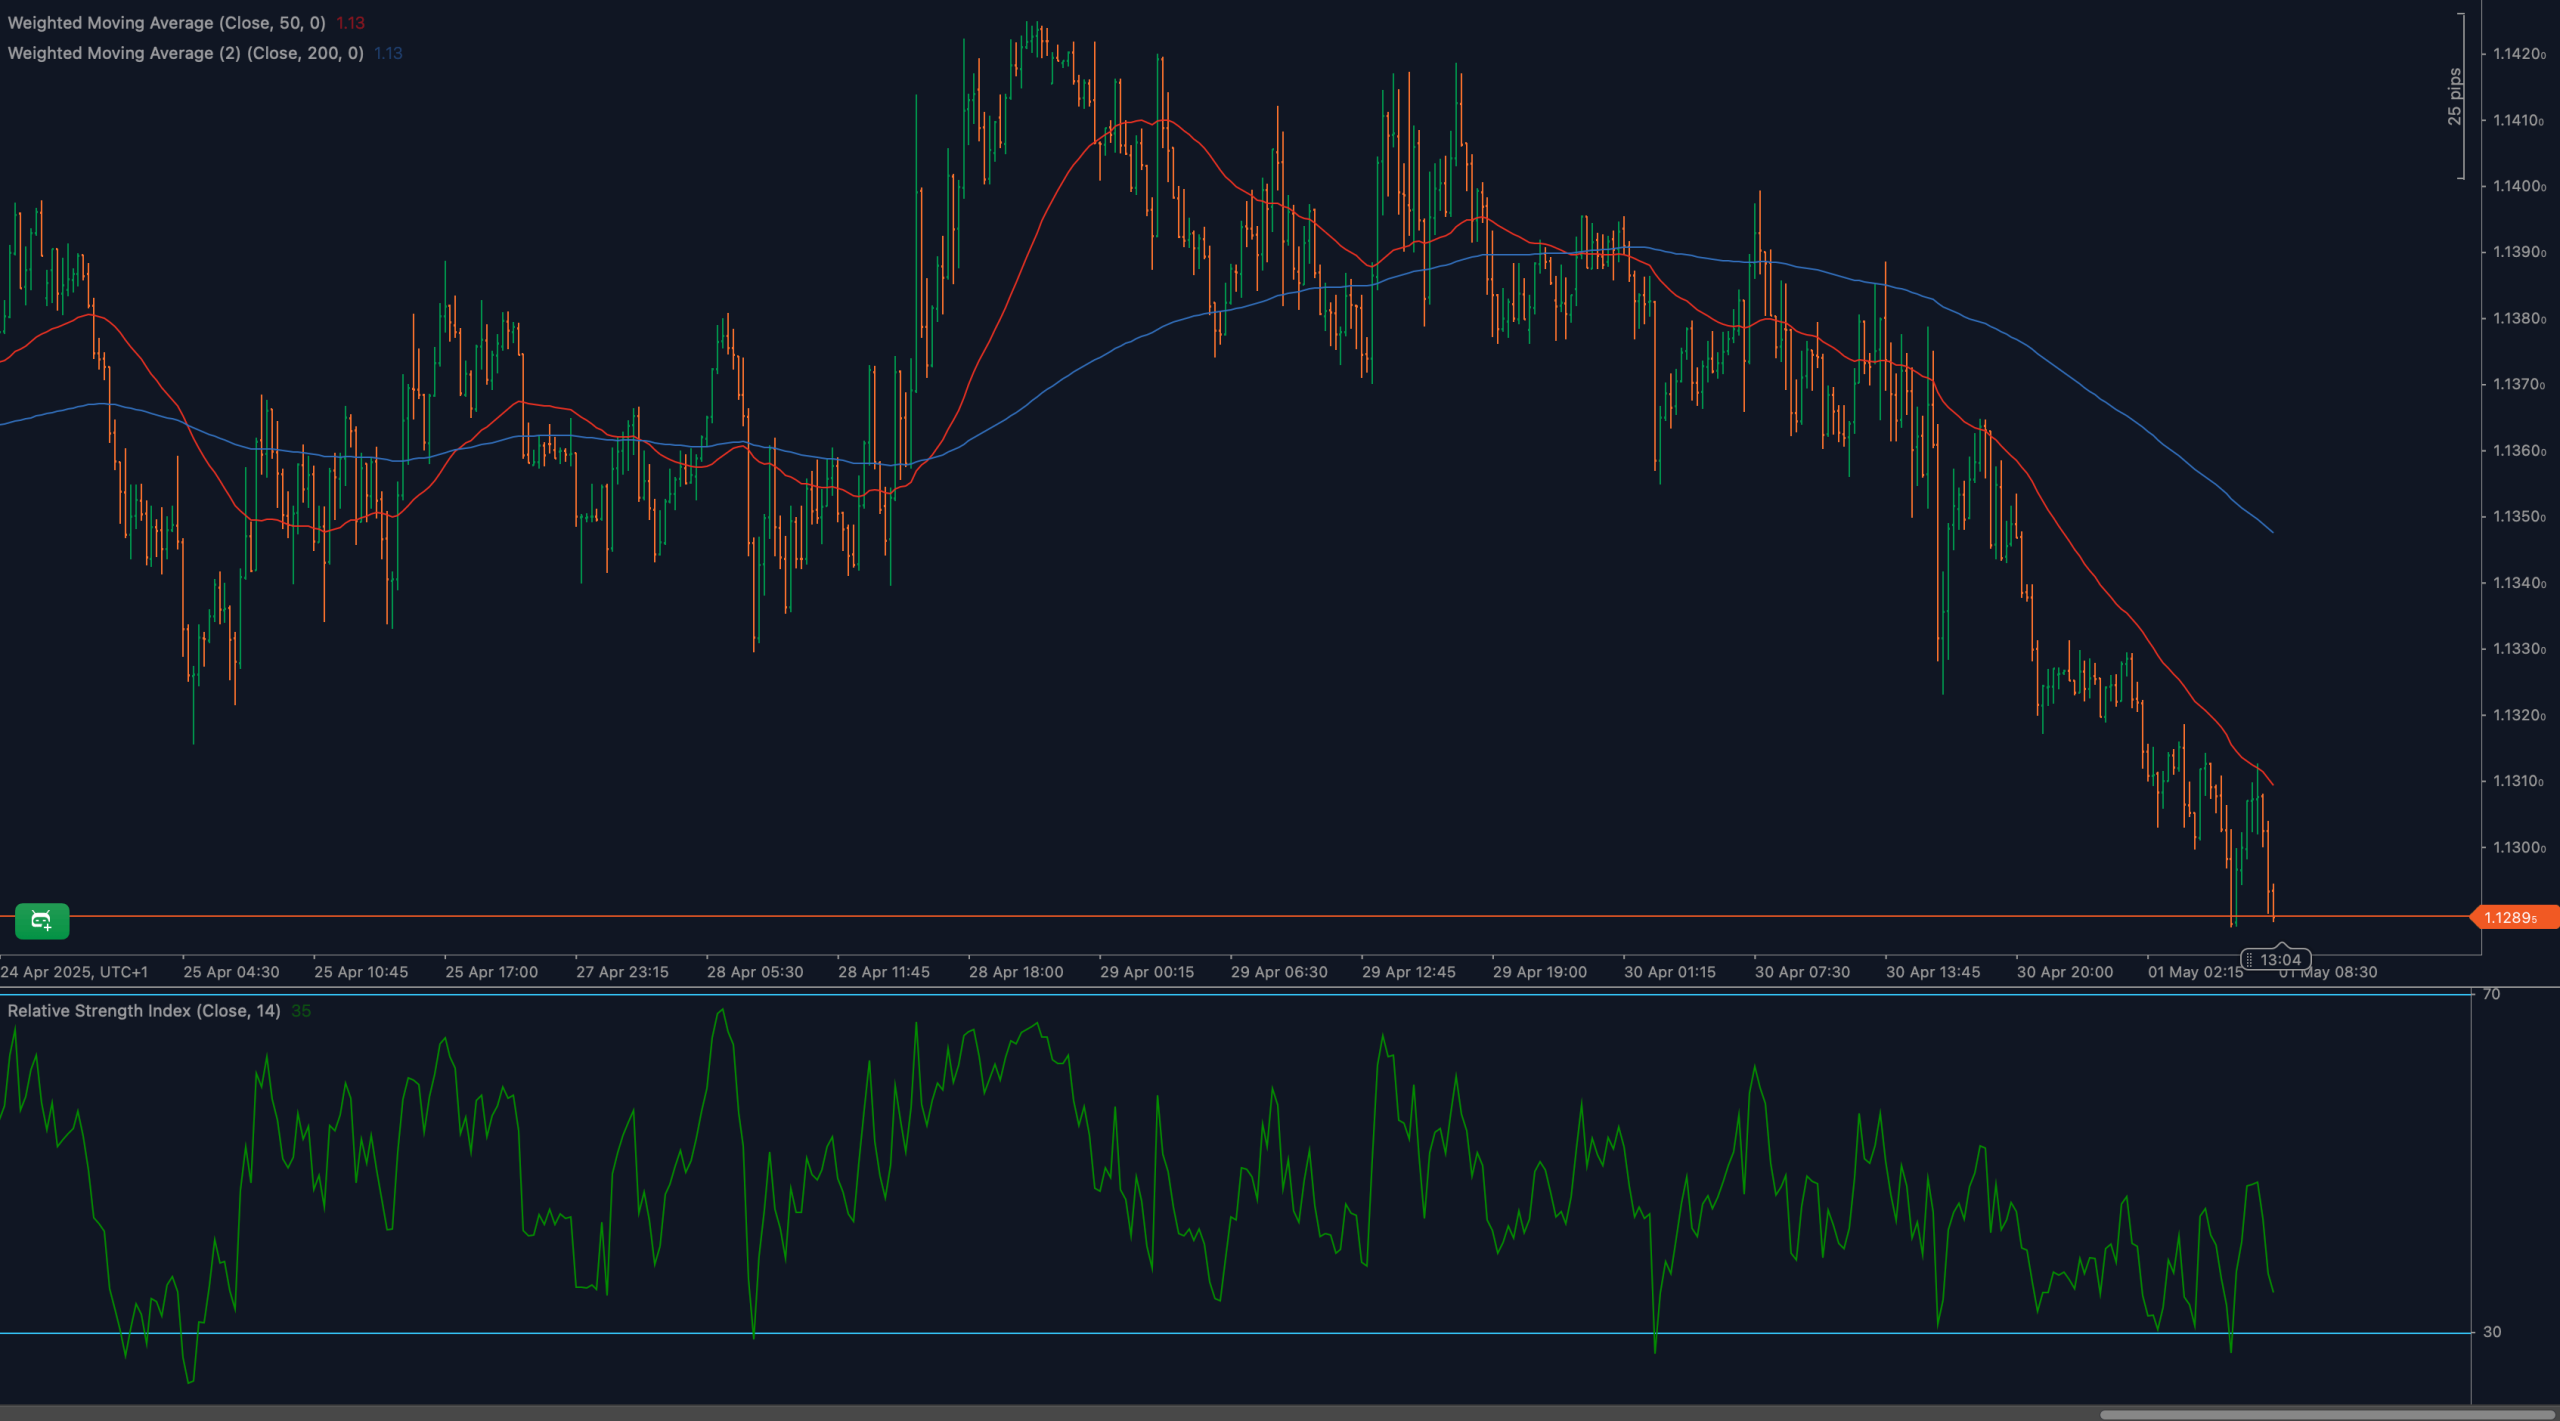
The euro continues to weaken against the dollar as EUR/USD breaks decisively below 1.1300, marking a fresh multi-session low. The pair has trended lower for several days, and this breakdown signals a continuation of bearish dominance in the current environment.
RSI momentum is deteriorating further, and the price is now trading well beneath both its 50- and 200-period moving averages. Unless bulls quickly reclaim broken support, the risk of extended downside remains elevated.
📈 TECHNICAL ANALYSIS
What Are the Key Support and Resistance Levels for EUR/USD?
The nearest support now lies at 1.1285, with next levels at 1.1265 and 1.1240 — previous reaction zones from early April. Resistance has shifted down to the former support at 1.1300, then 1.1325. The broader bearish structure remains intact below these levels.
Moving Average Analysis and Dynamic Price Levels
EUR/USD trades below the 50-period WMA (1.1313) and the 200-period WMA (1.1313). Both moving averages are sloping lower and accelerating in bearish alignment. The crossover that occurred earlier this week continues to guide sellers. The 50-WMA is now acting as dynamic resistance.
RSI Momentum Analysis and Divergence Patterns
The 14-period RSI is currently at 35, near the oversold boundary but without signs of divergence. The consistent reading below 40 confirms sustained bearish momentum. If RSI dips below 30, it could trigger a technical oversold signal, though not necessarily an immediate reversal.
Price Action and Candlestick Analysis
Recent candles show clear directional bias — large-bodied bearish candles with limited lower wicks, reflecting strong selling pressure. Today’s session broke decisively below 1.1300 with confirmation on follow-through. No bullish reversal pattern is currently visible, keeping downside risks elevated.
Chart Patterns and Formation Analysis
EUR/USD appears to be forming a bearish continuation breakdown following a descending channel. The recent acceleration suggests the lower trendline may be giving way, transitioning the structure into an open leg of downward extension. No base or consolidation zone has formed yet.
Fibonacci Retracement Levels and Extension Targets
Using the swing high at 1.1420 and the recent low at 1.1285, Fibonacci extensions suggest short-term targets at 1.1265(127.2%) and 1.1240 (161.8%). If the 1.1300 level is not reclaimed quickly, these zones may be reached in the next sessions.
🔍 MARKET OUTLOOK & TRADING SCENARIOS
Bullish Scenario for EUR/USD
A recovery back above 1.1300, followed by a close above 1.1320, would reduce immediate bearish pressure. RSI would need to reclaim 45+, and a bullish engulfing candle would add confidence. Until then, any long attempts remain countertrend.
Neutral Scenario for EUR/USD
If price begins to oscillate between 1.1285–1.1300, this could mark a temporary base. RSI stabilizing around 35–45 would support a short-term consolidation view. In that case, range-bound trading may dominate while traders await confirmation.
Bearish Scenario for EUR/USD
A continued move below 1.1285, with RSI dropping toward or below 30, would confirm momentum-based continuation. Downside targets include 1.1265 and 1.1240. Watch for rejection candles near 1.1300 as potential re-entry zones for trend followers.
💼 TRADING CONSIDERATIONS
For bears, short opportunities below 1.1300 remain favorable, with targets at 1.1265 and 1.1240. Stops can be positioned above 1.1320 to protect against a squeeze.
For bulls, setups are highly speculative until a clear base forms. Only a strong close above 1.1320 with volume and RSI confirmation would justify contrarian long positions.
Traders may also watch for intraday scalping setups within the 1.1285–1.1300 pocket until breakout or reversal develops.
🏁 CONCLUSION
EUR/USD has officially broken below the 1.1300 support, confirming continuation of the bearish sequence. With RSI weakening and no reversal pattern in sight, downside risks remain in play. A test of lower levels like 1.1265 or 1.1240may follow unless bulls stage an immediate reclaim.
⚠️ DISCLAIMER
This analysis is for informational purposes only and does not constitute trading advice. All markets carry risk. Please consult with a licensed advisor before making investment decisions.


