
📊 MARKET OVERVIEW
Silver (XAG/USD) staged an impulsive breakout toward the $33.50 level, only to reverse sharply after meeting resistance. The move above recent consolidation highs initially suggested bullish continuation, but follow-through buying failed, leading to a retracement back toward $33.30.
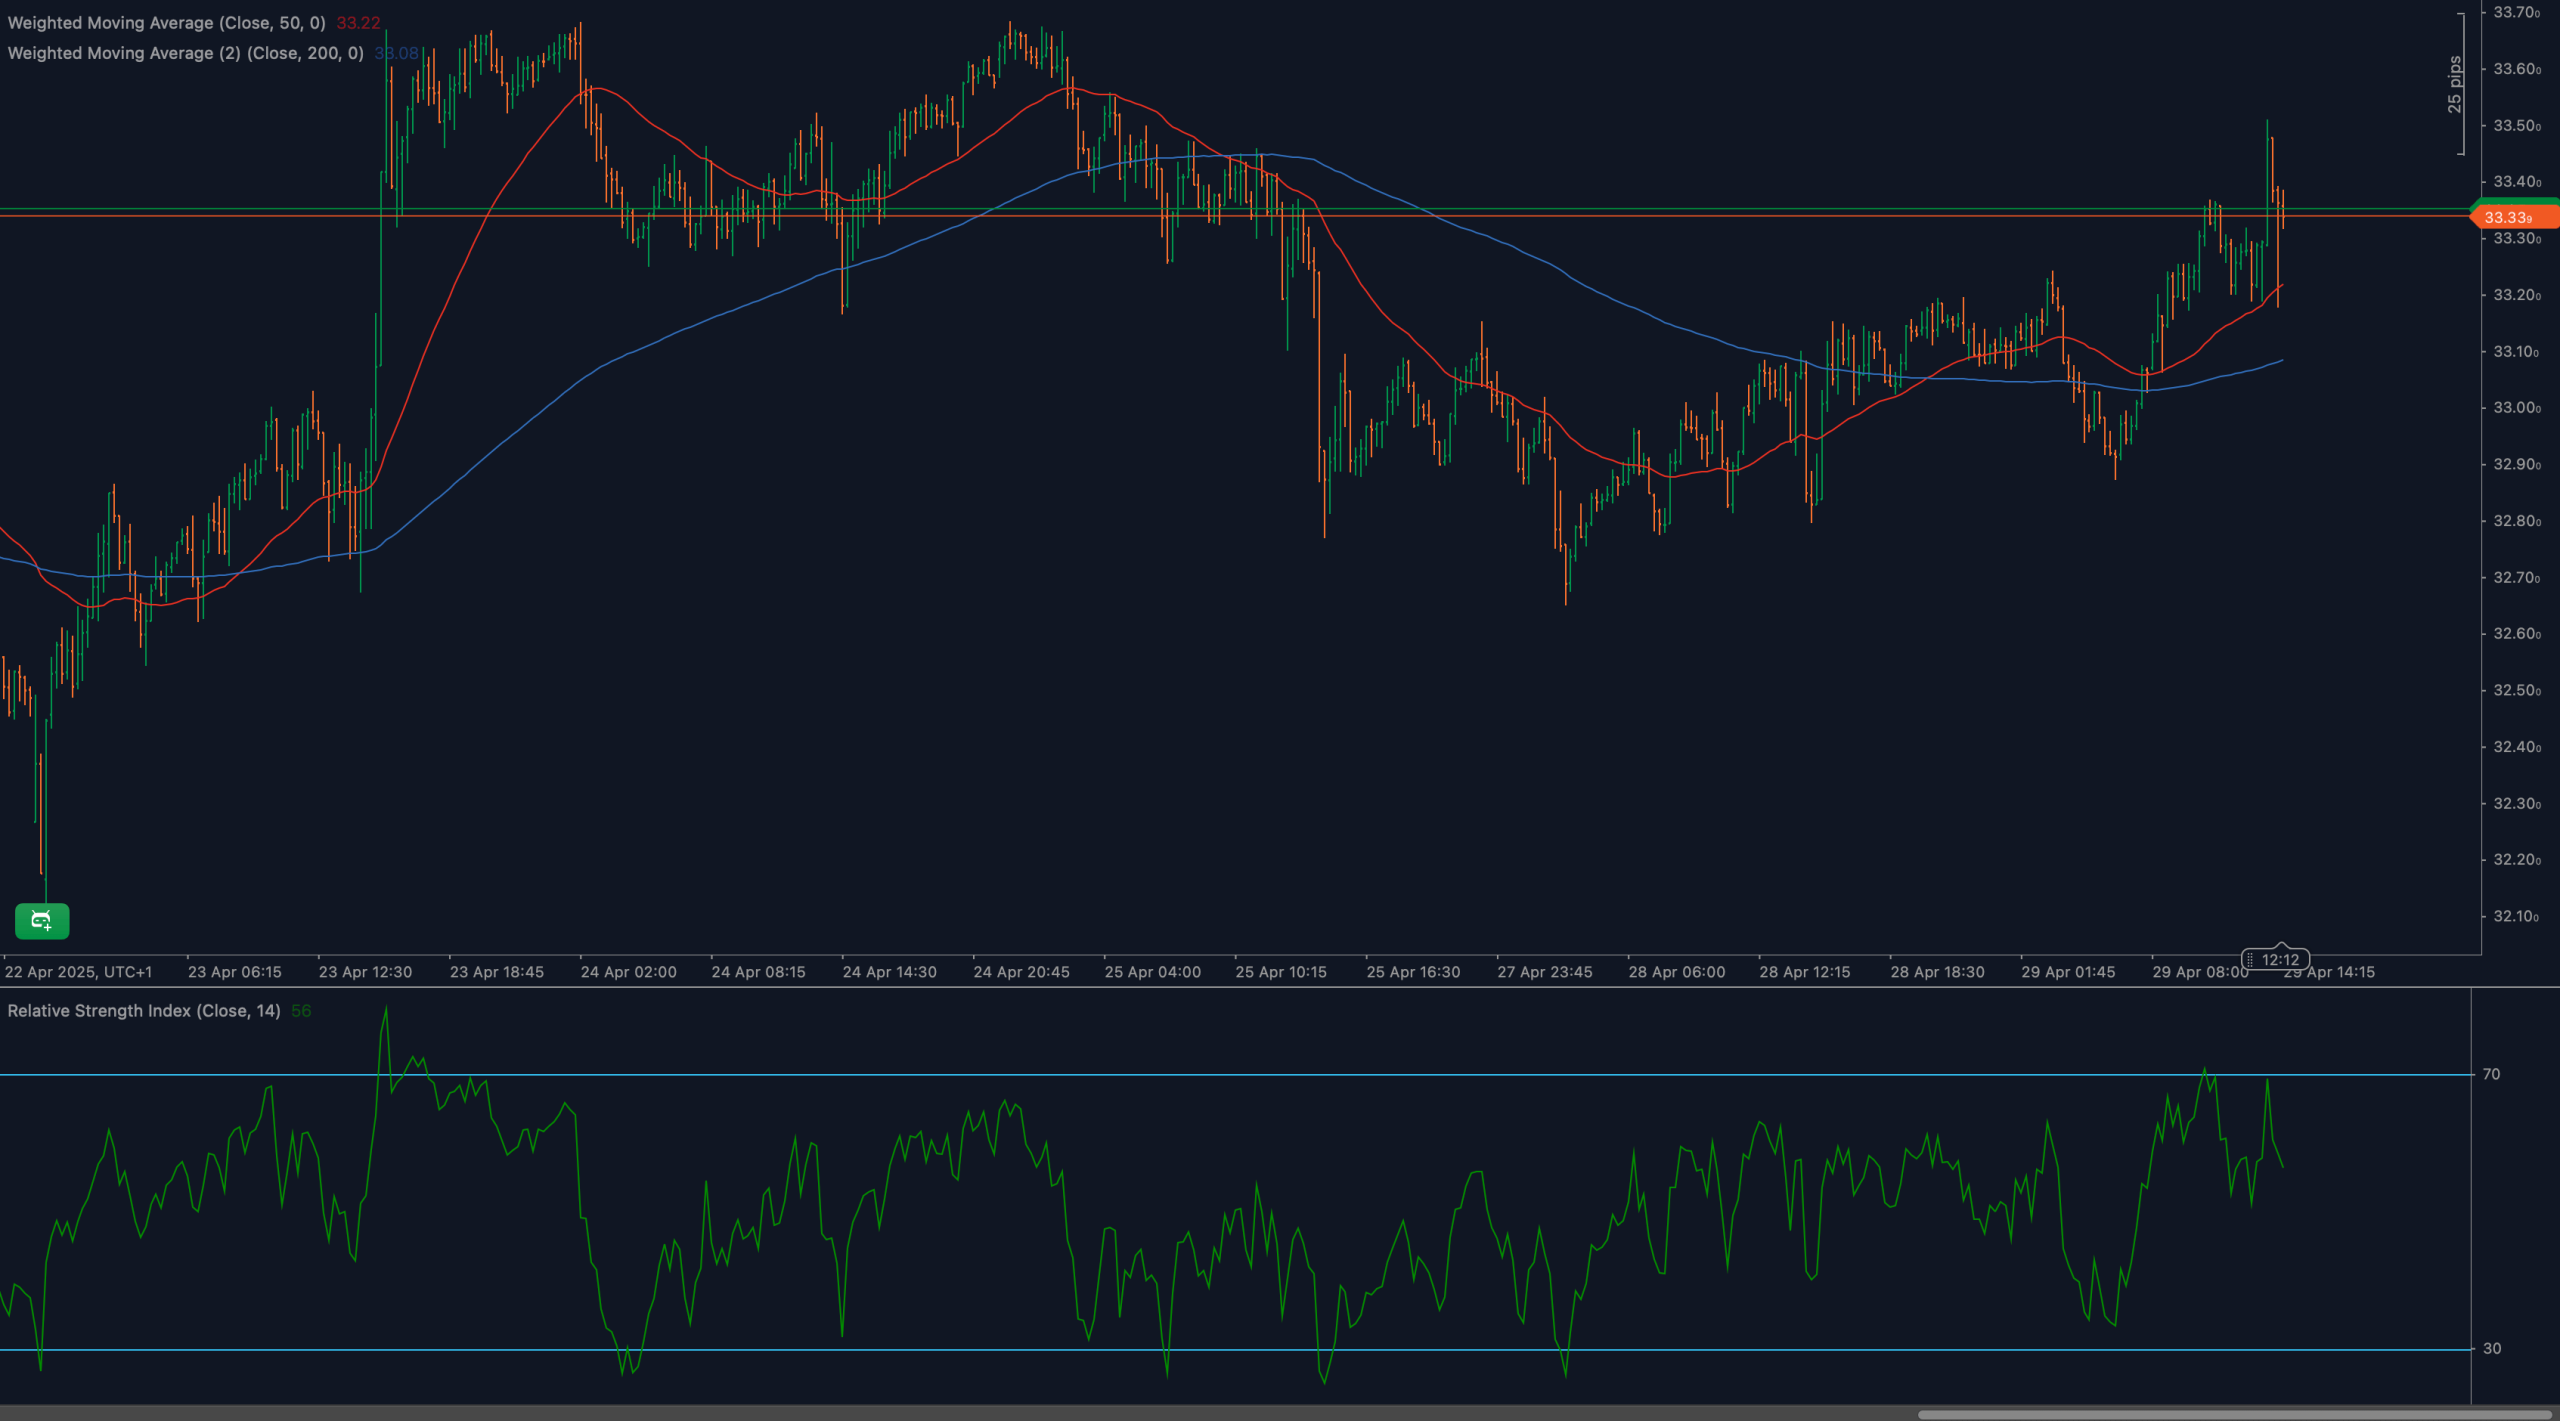
Despite the rejection, the broader structure remains cautiously bullish. The price is holding above the 200-period weighted moving average, and the RSI remains above neutral. However, recent volatility and the rejection wick raise the risk of consolidation or a deeper pullback unless bulls reclaim control quickly.
📈 TECHNICAL ANALYSIS
What Are the Key Support and Resistance Levels for XAG/USD?
Immediate resistance stands at $33.50, the spike high and psychological ceiling. A break and close above this level would open targets at $33.80 and $34.10. On the downside, short-term support lies at $33.30, followed by $33.05, the area near the 200-WMA. Deeper support is located at $32.70.
Moving Average Analysis and Dynamic Price Levels
The 50-period WMA ($33.22) is now sloping upward and was recently reclaimed, indicating a bullish short-term shift. The 200-period WMA ($33.08) continues to flatten after a long downtrend, providing dynamic support. If price remains above these averages, trend bias stays positive. However, a return below both could signal exhaustion.
RSI Momentum Analysis and Divergence Patterns
The 14-period RSI peaked just below 70 and has since cooled to 56, reflecting a loss of bullish momentum after the breakout. While the reading is still in neutral territory, the failure to sustain overbought levels hints at weakening trend conviction. No clear divergence is present yet, but a lower high in RSI on another price rally could signal bearish divergence.
Price Action and Candlestick Analysis
The large upper wick from the $33.50 spike candle suggests aggressive rejection by sellers. Follow-up candles show indecision with smaller bodies and a bearish tilt. Unless bulls can post a strong bullish engulfing or closing breakout candle, the current setup leans toward correction or range formation rather than immediate continuation.
Chart Patterns and Formation Analysis
The current structure may evolve into a bullish flag or ascending triangle, depending on how price behaves near $33.30. A flat-top triangle breakout above $33.50 would confirm bullish continuation. Conversely, if price breaks down through $33.05, the pattern would collapse into a broader consolidation.
Fibonacci Retracement Levels and Extension Targets
Using the swing low near $32.20 and the $33.50 high, the 23.6% retracement lands at $33.20, and the 38.2% retracement aligns near $33.05 — both key support levels. A successful breakout above $33.50 projects extension targets at $33.80 (127.2%) and $34.10 (161.8%).
🔍 MARKET OUTLOOK & TRADING SCENARIOS
Bullish Scenario for XAG/USD
A confirmed breakout above $33.50, ideally supported by bullish volume and RSI pushing back toward 65–70, would validate bullish continuation. Targets include $33.80 and $34.10. Reclaiming $33.50 convincingly would indicate that the pullback was just a temporary rejection.
Neutral Scenario for XAG/USD
If silver continues trading between $33.05 and $33.50, consolidation will likely persist. This range could favor intraday range scalping strategies. RSI between 50–60 would support this view, indicating balance rather than directional pressure.
Bearish Scenario for XAG/USD
A breakdown below $33.05, particularly if accompanied by RSI falling under 50 and bearish volume expansion, would signal reversal risk. In that case, downside targets lie at $32.70 and potentially $32.40. Failed retests of $33.30 from below would further confirm weakness.
💼 TRADING CONSIDERATIONS
Bullish traders should wait for confirmation above $33.50 with a strong candle close and increasing RSI. Targets include $33.80 and $34.10, with stops below $33.10.
Bearish trades may be considered on a confirmed breakdown below $33.05, targeting $32.70 and $32.40, with stops above $33.40.
Scalpers can range trade between $33.05 and $33.50 until a clear breakout emerges.
🏁 CONCLUSION
Silver (XAG/USD) surged above $33.50 but was swiftly rejected, highlighting resistance at this key level. With RSI cooling and candlesticks signaling hesitation, traders should remain cautious. A breakout or breakdown from the current range will determine the next major move. Eyes on $33.05 and $33.50 — the levels that matter most now.
⚠️ DISCLAIMER
This analysis is for informational purposes only and does not constitute investment advice. Trading involves significant risk. Please consult with a licensed financial advisor before making trading decisions.


