
📊 MARKET OVERVIEW
USD/JPY has staged a solid rebound from the recent 139.00 lows, now pushing into a well-defined resistance zone around 142.65. This level served as a reversal point on prior attempts and aligns with a key horizontal structure that dates back to April highs.
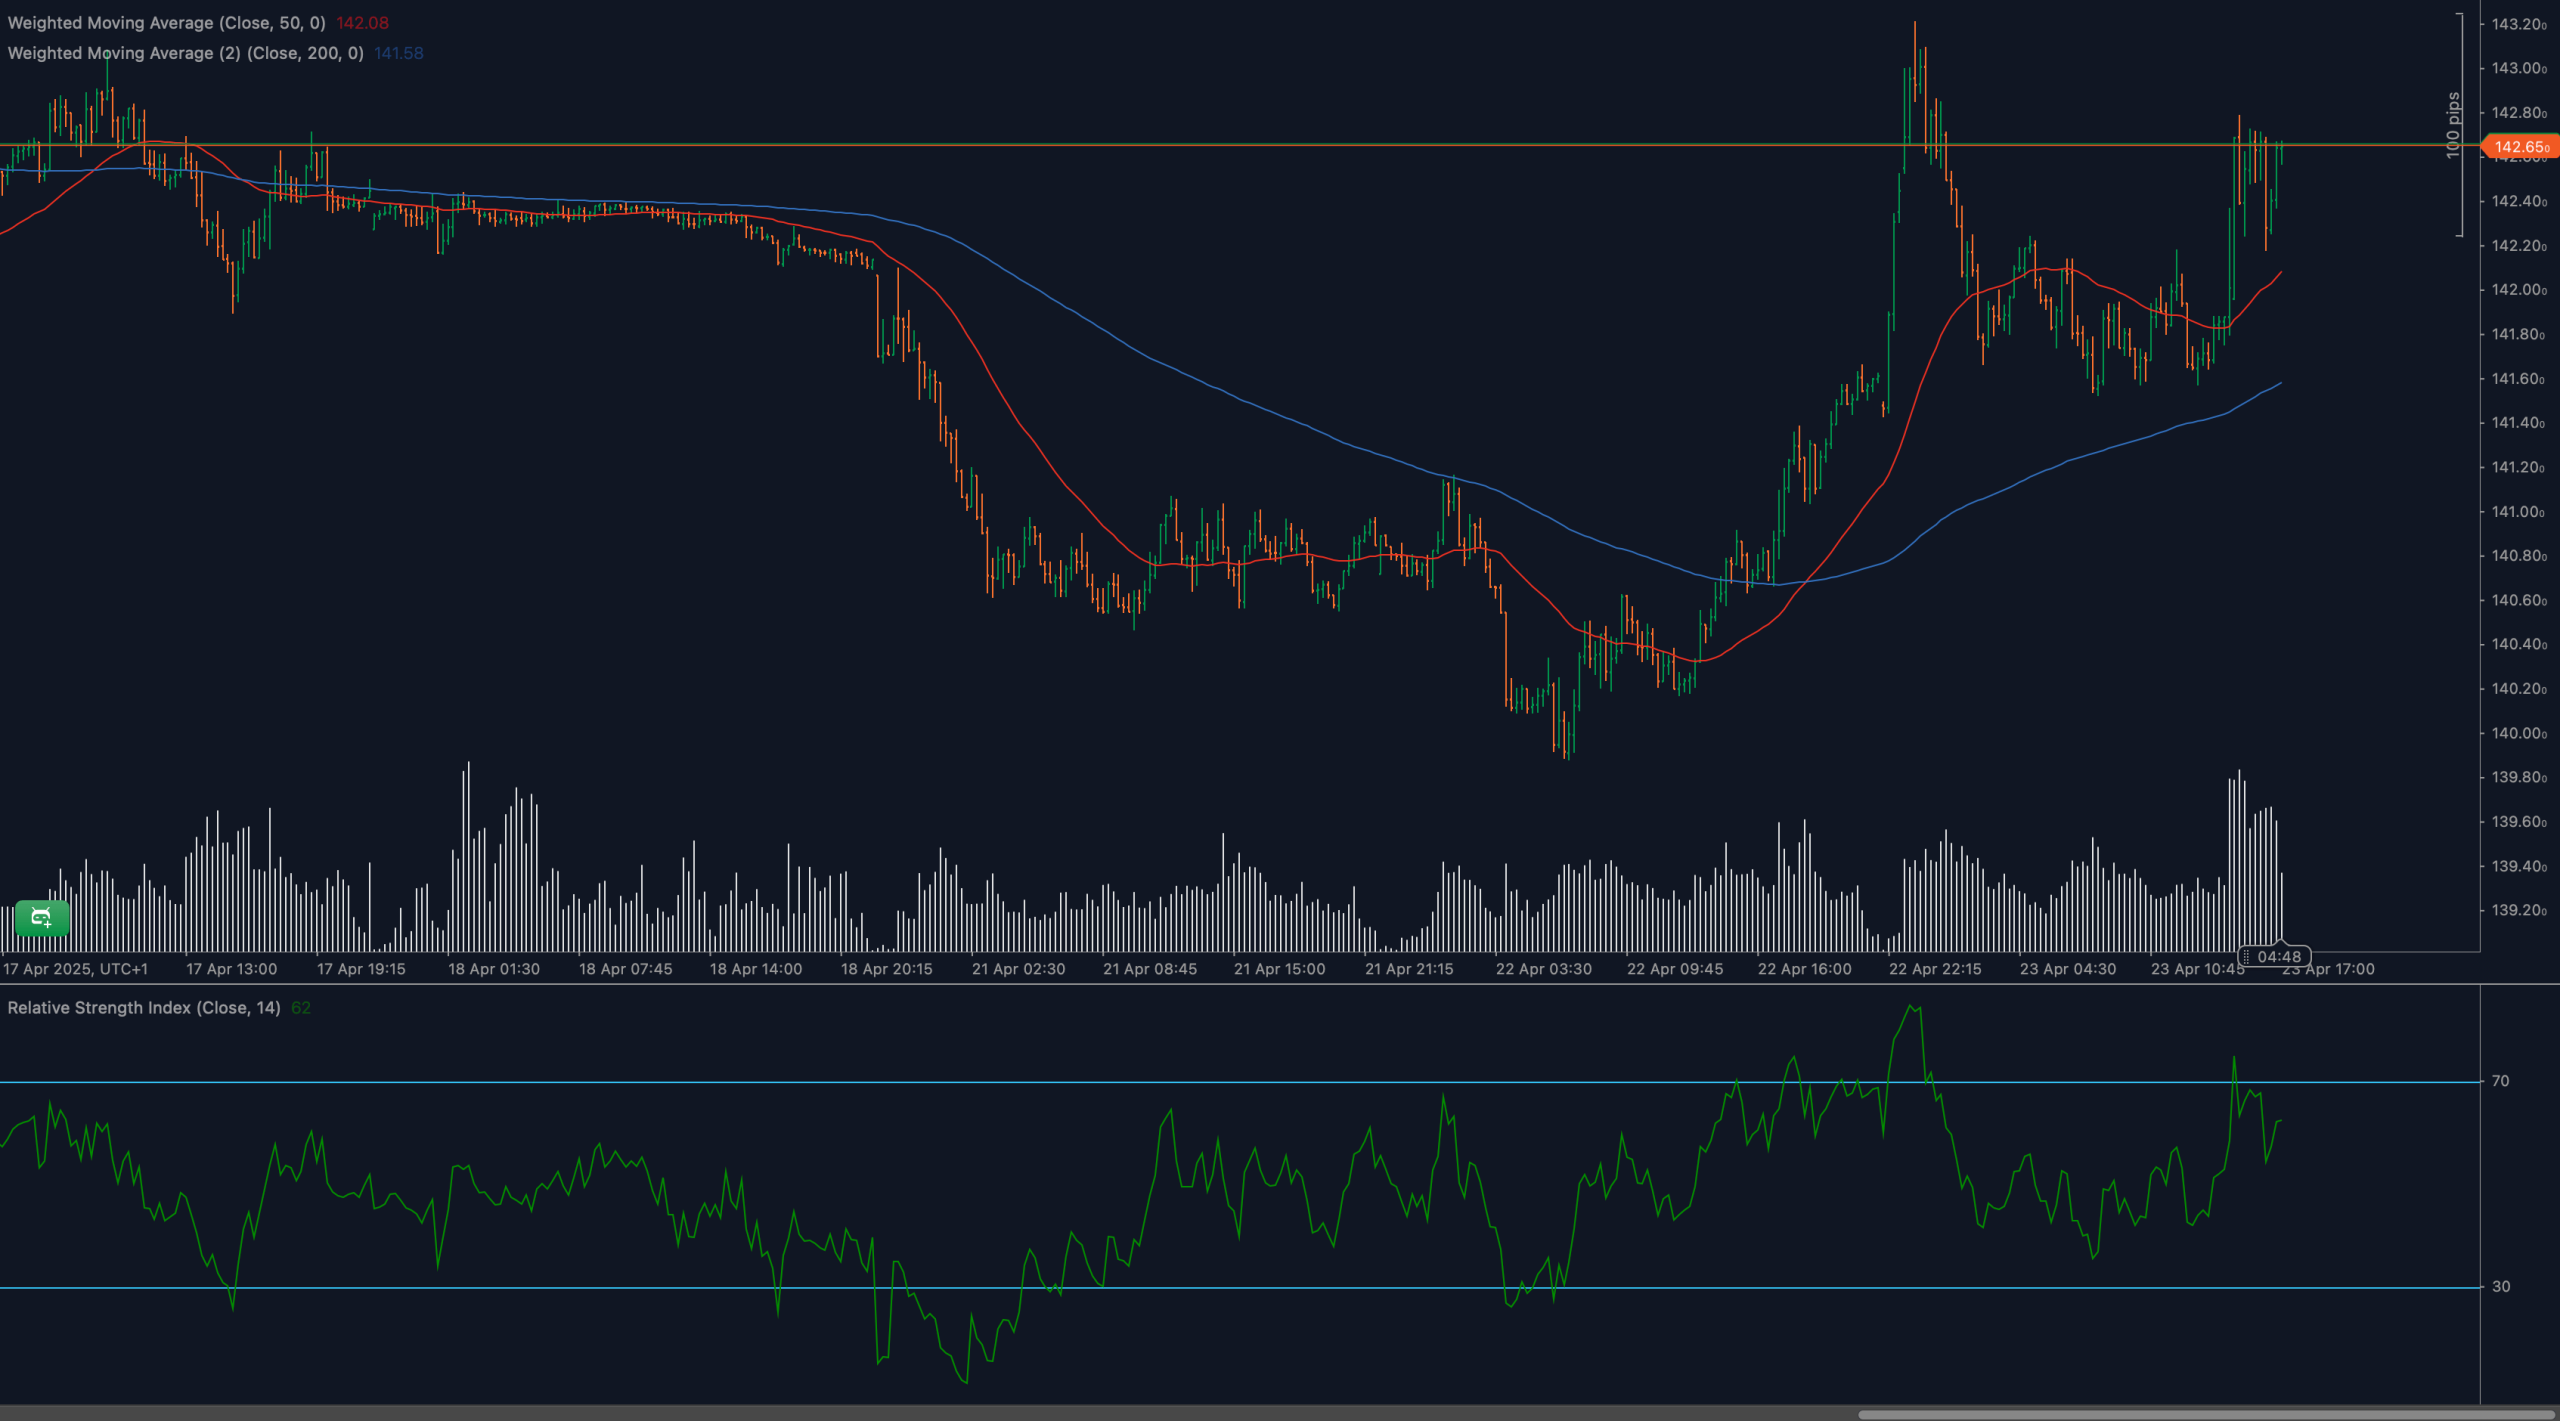
Momentum has shifted bullishly in the short term. The price is now firmly above the 50-period weighted moving average, and the 200-WMA is beginning to flatten after months of decline. With RSI rising above 60 and volume expanding on green candles, the technical picture favors further upside — but only if bulls can clear this final barrier.
📈 TECHNICAL ANALYSIS
What Are the Key Support and Resistance Levels for USD/JPY?
The primary resistance is 142.65, with a confirmed breakout opening upside toward 143.30 and potentially 144.10. On the downside, initial support is found at 141.80, backed by dynamic support from the 50-WMA. Stronger support levels follow at 140.80 and 139.50 — the origin of the recent reversal.
Moving Average Analysis and Dynamic Price Levels
USD/JPY is now trading above both the 50-period WMA (142.08) and 200-period WMA (141.58). The crossover of the 50 above the 200 is a classic bullish signal, confirming a shift in medium-term sentiment. These averages are also beginning to turn upward, providing structural support for the current move. A retest of the 50-WMA may act as a key decision point if price dips.
RSI Momentum Analysis and Divergence Patterns
The 14-period RSI is climbing, currently reading 62, signaling healthy momentum behind the recent move. This is the first time RSI has approached the overbought threshold since the mid-April breakdown. While no divergence is yet present, traders should monitor closely for potential momentum flattening if price stalls at resistance.
Price Action and Candlestick Analysis
Recent candlesticks show strong bullish conviction, with large bodies and minimal lower wicks. However, the most recent candles near 142.65 show reduced follow-through — a signal that buyers are encountering heavy supply. A bullish engulfing or strong breakout candle above resistance would confirm continuation. Conversely, a spinning topor bearish rejection here could indicate exhaustion.
Chart Patterns and Formation Analysis
The pair appears to have completed a rounded bottom reversal, forming from the 139.00 lows and curving up toward resistance. The current structure resembles a cup with handle breakout, though the handle remains shallow. A confirmed move above 142.65 would validate the pattern and project targets toward the 143.50–144.00 range.
Fibonacci Retracement Levels and Extension Targets
Measuring from the 144.10 high to the 139.00 low, the 61.8% Fibonacci retracement lies right at 142.65, adding technical weight to this resistance. A breakout here opens the way toward the 78.6% level at 143.65, followed by the full extension near 144.10. A rejection would reintroduce retracement zones at 141.50 (38.2%) and 140.80 (50%).
🔍 MARKET OUTLOOK & TRADING SCENARIOS
Bullish Scenario for USD/JPY
A clean breakout above 142.65, especially on increased volume and RSI pushing toward 70, would confirm trend continuation. This would set up a bullish move toward 143.30, with an extended target at 144.10. Entries could be considered on a strong candle close above the resistance line, with stops below 141.80.
Neutral Scenario for USD/JPY
If price consolidates below 142.65, traders may expect sideways action between 141.80 and 142.65. This would reflect indecision before the next major directional move. A breakout from this zone would offer clarity, while RSI hovering in the 55–65 range would support this view.
Bearish Scenario for USD/JPY
Failure to break 142.65, followed by a drop below 141.80, could trigger a bearish pullback. This would be further confirmed if RSI dips below 50 and bearish volume increases. Downside targets would then be 140.80 and 139.50, especially if price closes under the 200-WMA.
💼 TRADING CONSIDERATIONS
Bullish traders should watch for breakout confirmation above 142.65, preferably supported by volume spikes and RSI holding above 60. Entries could target 143.30 and 144.10, with stops below 141.80.
For bears, a failed breakout followed by RSI rollover and bearish reversal patterns would justify shorts toward 141.50or lower. Ideal stop-loss placement would be above 142.90 to protect against fakeouts.
Scalpers may consider range trades while price holds within 141.80–142.65, using intraday candles for confirmation.
🏁 CONCLUSION
USD/JPY has rebounded sharply and is now testing the 142.65 resistance level with rising momentum and a positive moving average crossover. RSI remains supportive of further gains, but hesitation near this key zone raises the possibility of a reversal. A confirmed breakout or rejection will set the tone for the next phase. Traders should be ready for either scenario — with technical signals aligning for a breakout bias, but confirmation still needed.
⚠️ DISCLAIMER
This analysis is for educational purposes only and does not constitute trading advice. Always conduct your own analysis and consult a licensed financial advisor before making any trading decisions.


