
📊 MARKET OVERVIEW
The US Dollar Index (DXY) remains under pressure below the psychologically significant 99.50 level. After failing multiple times to reclaim this zone, price continues to hover around minor support at 99.30, unable to gain upward traction. With both short- and long-term moving averages sloping downward and acting as resistance, sentiment remains bearish.
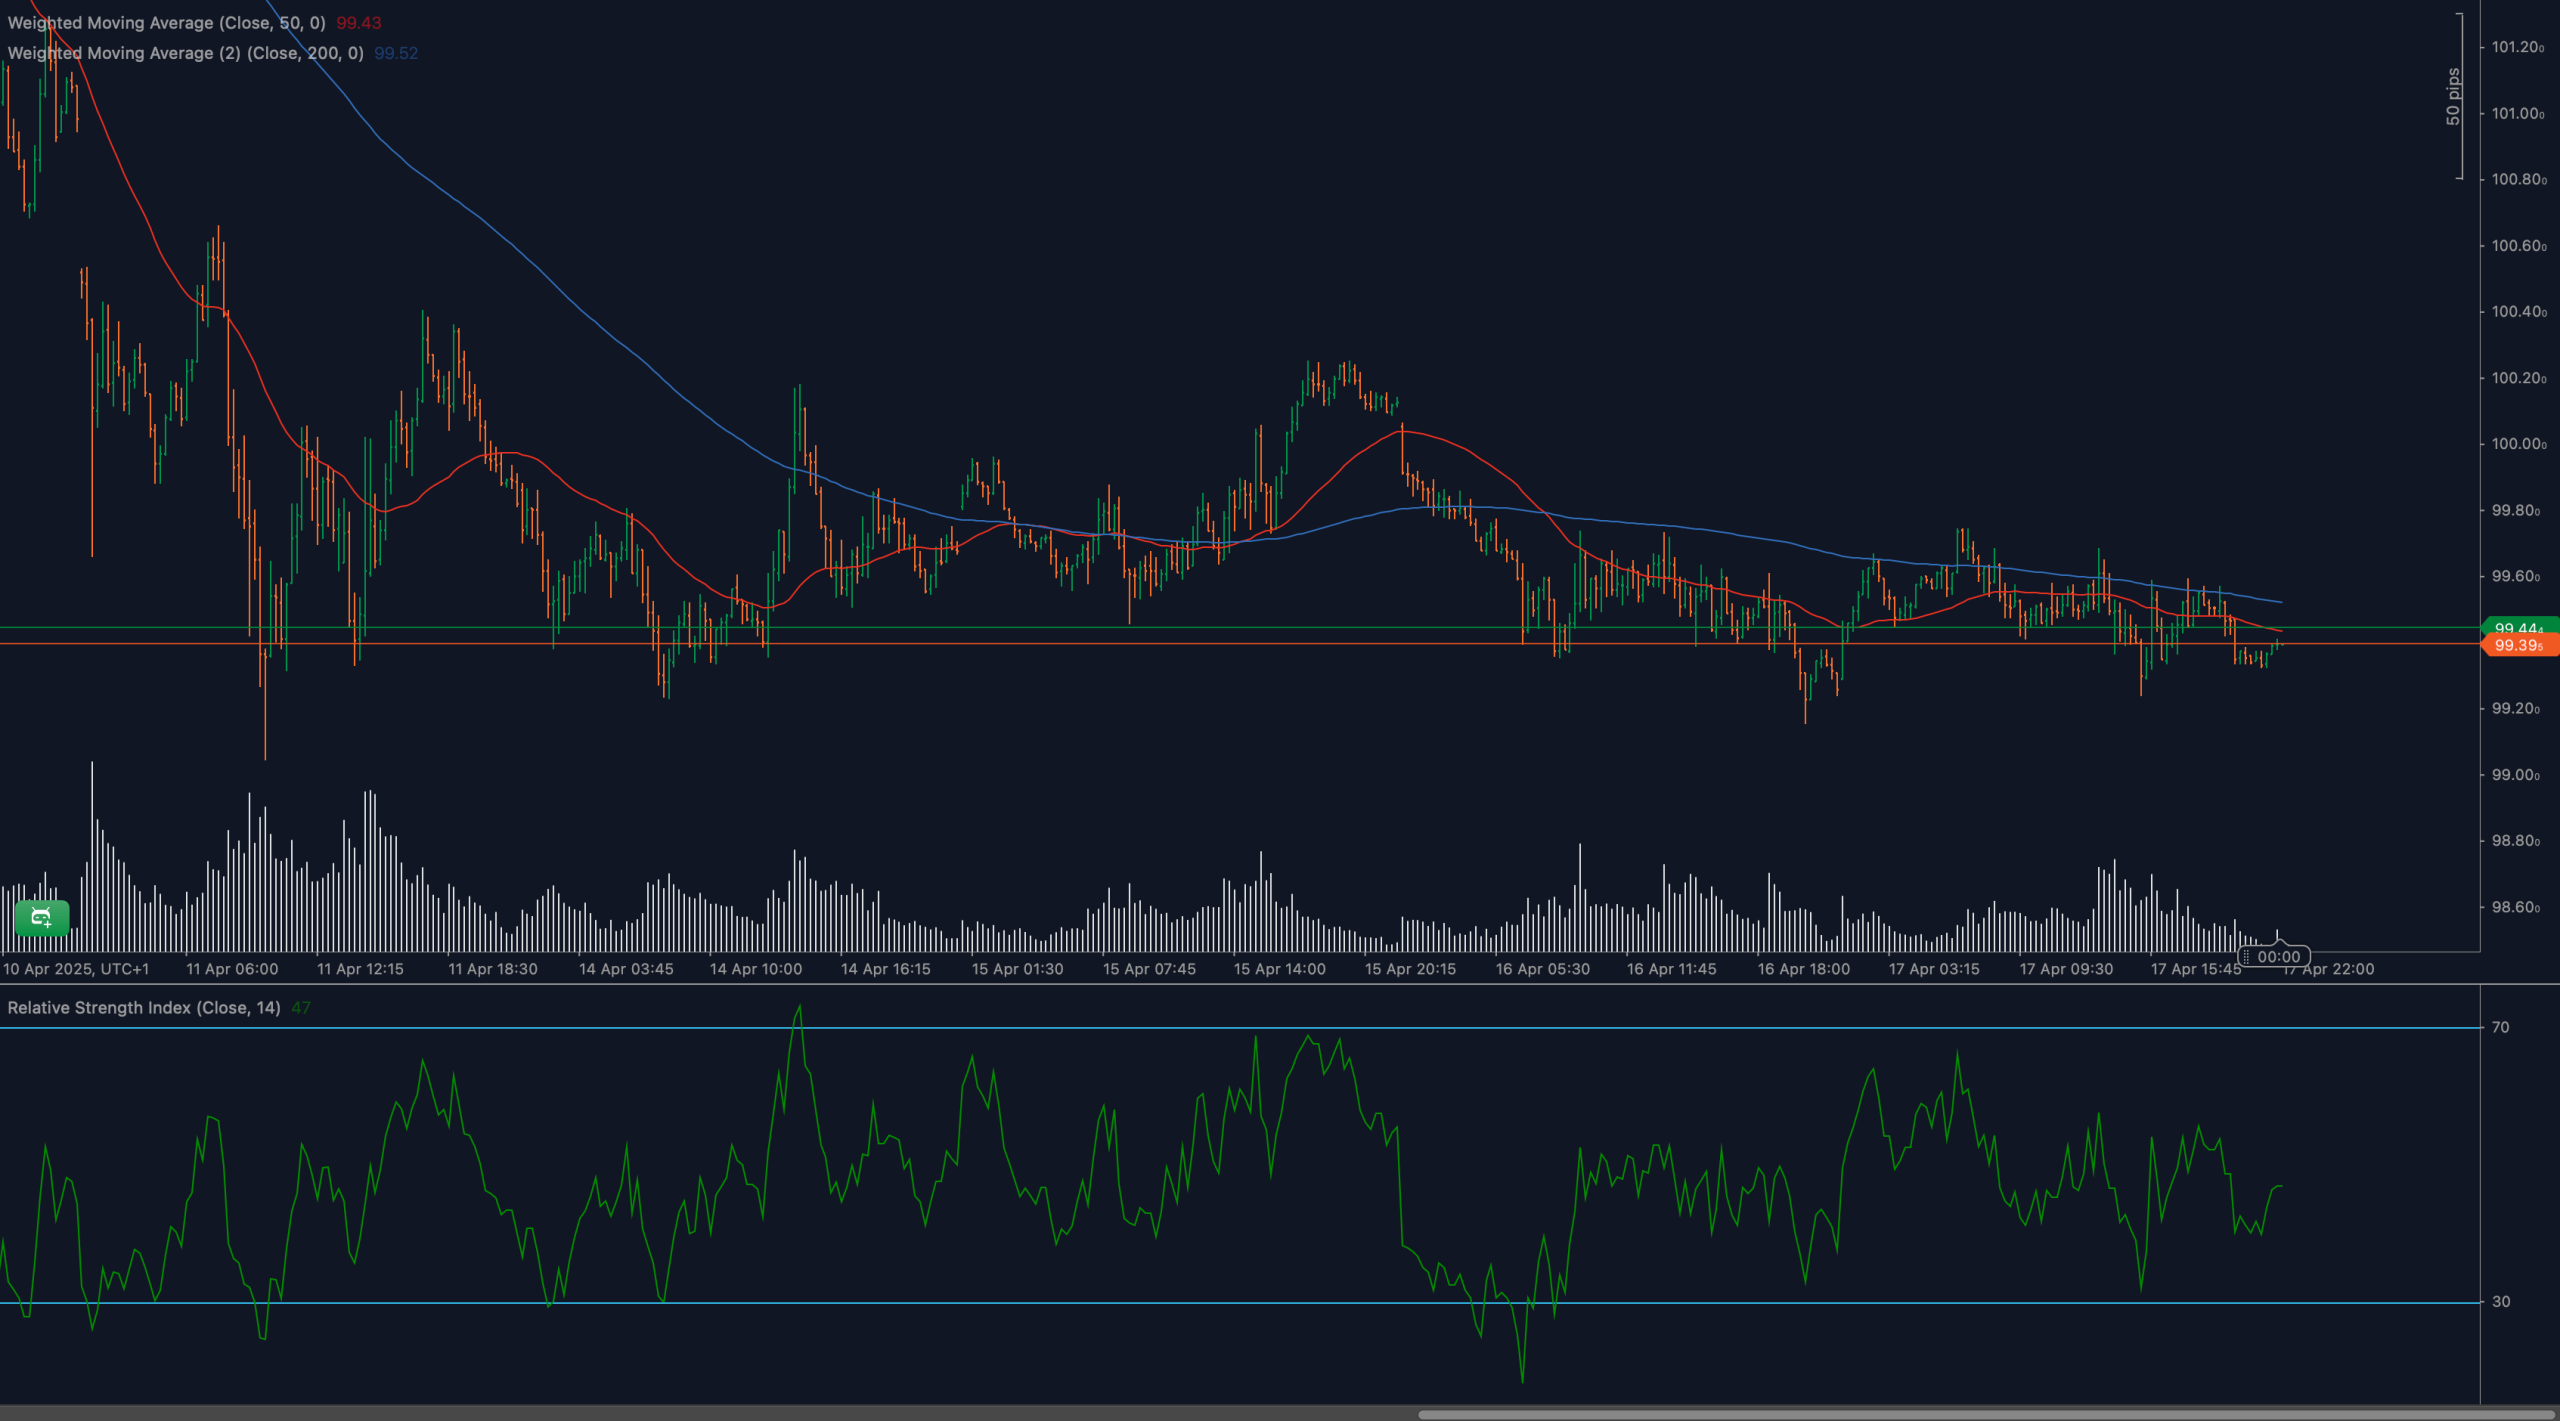
Volume remains relatively low, and there’s a lack of directional momentum from buyers. Despite brief intraday rallies, price action has been consistently rejected near the 50-period WMA. The Dollar’s inability to mount a sustained recovery reflects weak demand and rising pressure from broader market dynamics.
📈 TECHNICAL ANALYSIS
What Are the Key Support and Resistance Levels for DXY?
Immediate resistance sits at 99.50, a level that has capped recent attempts to rebound. A sustained break above this level could target 99.70 and potentially 99.90. Key support remains at 99.20, with a more significant floor near 99.00. If that fails, downside targets open to 98.80 and 98.60 — levels not seen in several weeks.
Moving Average Analysis and Dynamic Price Levels
DXY is currently trading below both the 50-period WMA (99.43) and the 200-period WMA (99.52), both of which are sloping downward. This setup reinforces bearish sentiment and suggests rallies are likely to face strong overhead resistance. Until price can break and close above these levels, sellers remain in control.
RSI Momentum Analysis and Divergence Patterns
The 14-period RSI hovers near 47, reflecting a neutral stance. This midpoint reading suggests neither strong bullish nor bearish conviction, though the broader price trend favors downside. There are currently no visible bullish or bearish divergences, but RSI’s failure to cross above 60 on recent rallies hints at weak buyer follow-through.
Price Action and Candlestick Analysis
Recent candlestick formations highlight repeated rejections above 99.45, with long upper wicks and small-bodied candles indicative of fading momentum. The lack of decisive bullish closes and weak volume behind intraday pushes reinforces the broader bearish outlook. The market seems hesitant to commit, which adds risk for both sides.
Chart Patterns and Formation Analysis
A descending channel or flat-bottom triangle pattern may be developing, with horizontal support at 99.20 and gradually lower highs forming over time. This setup typically precedes a bearish continuation if support gives way. Conversely, a break above the descending resistance line could invalidate the pattern and favor a corrective bounce.
Fibonacci Retracement Levels and Extension Targets
Using the swing high near 100.20 and recent low at 99.00, the 38.2% retracement is located at 99.45, with the 50% level at 99.60 and 61.8% at 99.75. These Fibonacci levels align well with horizontal resistance zones and should be monitored for rejection or breakout signs. Extension targets include 98.80 and 98.60 if the bearish move resumes.
🔍 MARKET OUTLOOK & TRADING SCENARIOS
Bullish Scenario for DXY
If DXY can reclaim 99.50 and hold above it, with RSI pushing above 55 and price closing over both WMAs, a short-term bullish shift could emerge. Upside targets include 99.70 and 99.90, but confirmation via strong bullish candles and volume is essential.
Neutral Scenario for DXY
Should the index remain stuck between 99.20–99.50, expect continued range-bound trading. This scenario favors intraday range setups rather than directional positions, especially with RSI holding in the 45–55 zone and volume lacking conviction.
Bearish Scenario for DXY
A decisive move below 99.20, especially on volume and a close beneath this support, would signal renewed bearish pressure. In this case, targets shift toward 99.00, followed by 98.80. RSI dropping below 40 would further confirm bearish continuation.
💼 TRADING CONSIDERATIONS
Traders leaning bearish may consider short entries on failed rallies toward 99.45–99.50, with tight stops above 99.60, targeting 99.20 and 99.00. Short-term momentum and volume should be aligned with this strategy.
For bullish setups, traders must wait for a confirmed breakout above 99.50, with price closing above the 200-WMA and RSI above 55. Entries above 99.60 could then target 99.90, with stops below 99.40.
🏁 CONCLUSION
DXY remains technically weak beneath key resistance at 99.50, with both moving averages and price action suggesting limited buyer conviction. Until price clears this zone with volume and momentum, downside risks persist. Traders should focus on confirmation and avoid premature entries in this choppy environment.
⚠️ DISCLAIMER
This analysis is provided for educational purposes only and should not be considered financial advice. Trading involves risk. Please consult a licensed professional before making investment decisions.


