
📊 MARKET OVERVIEW
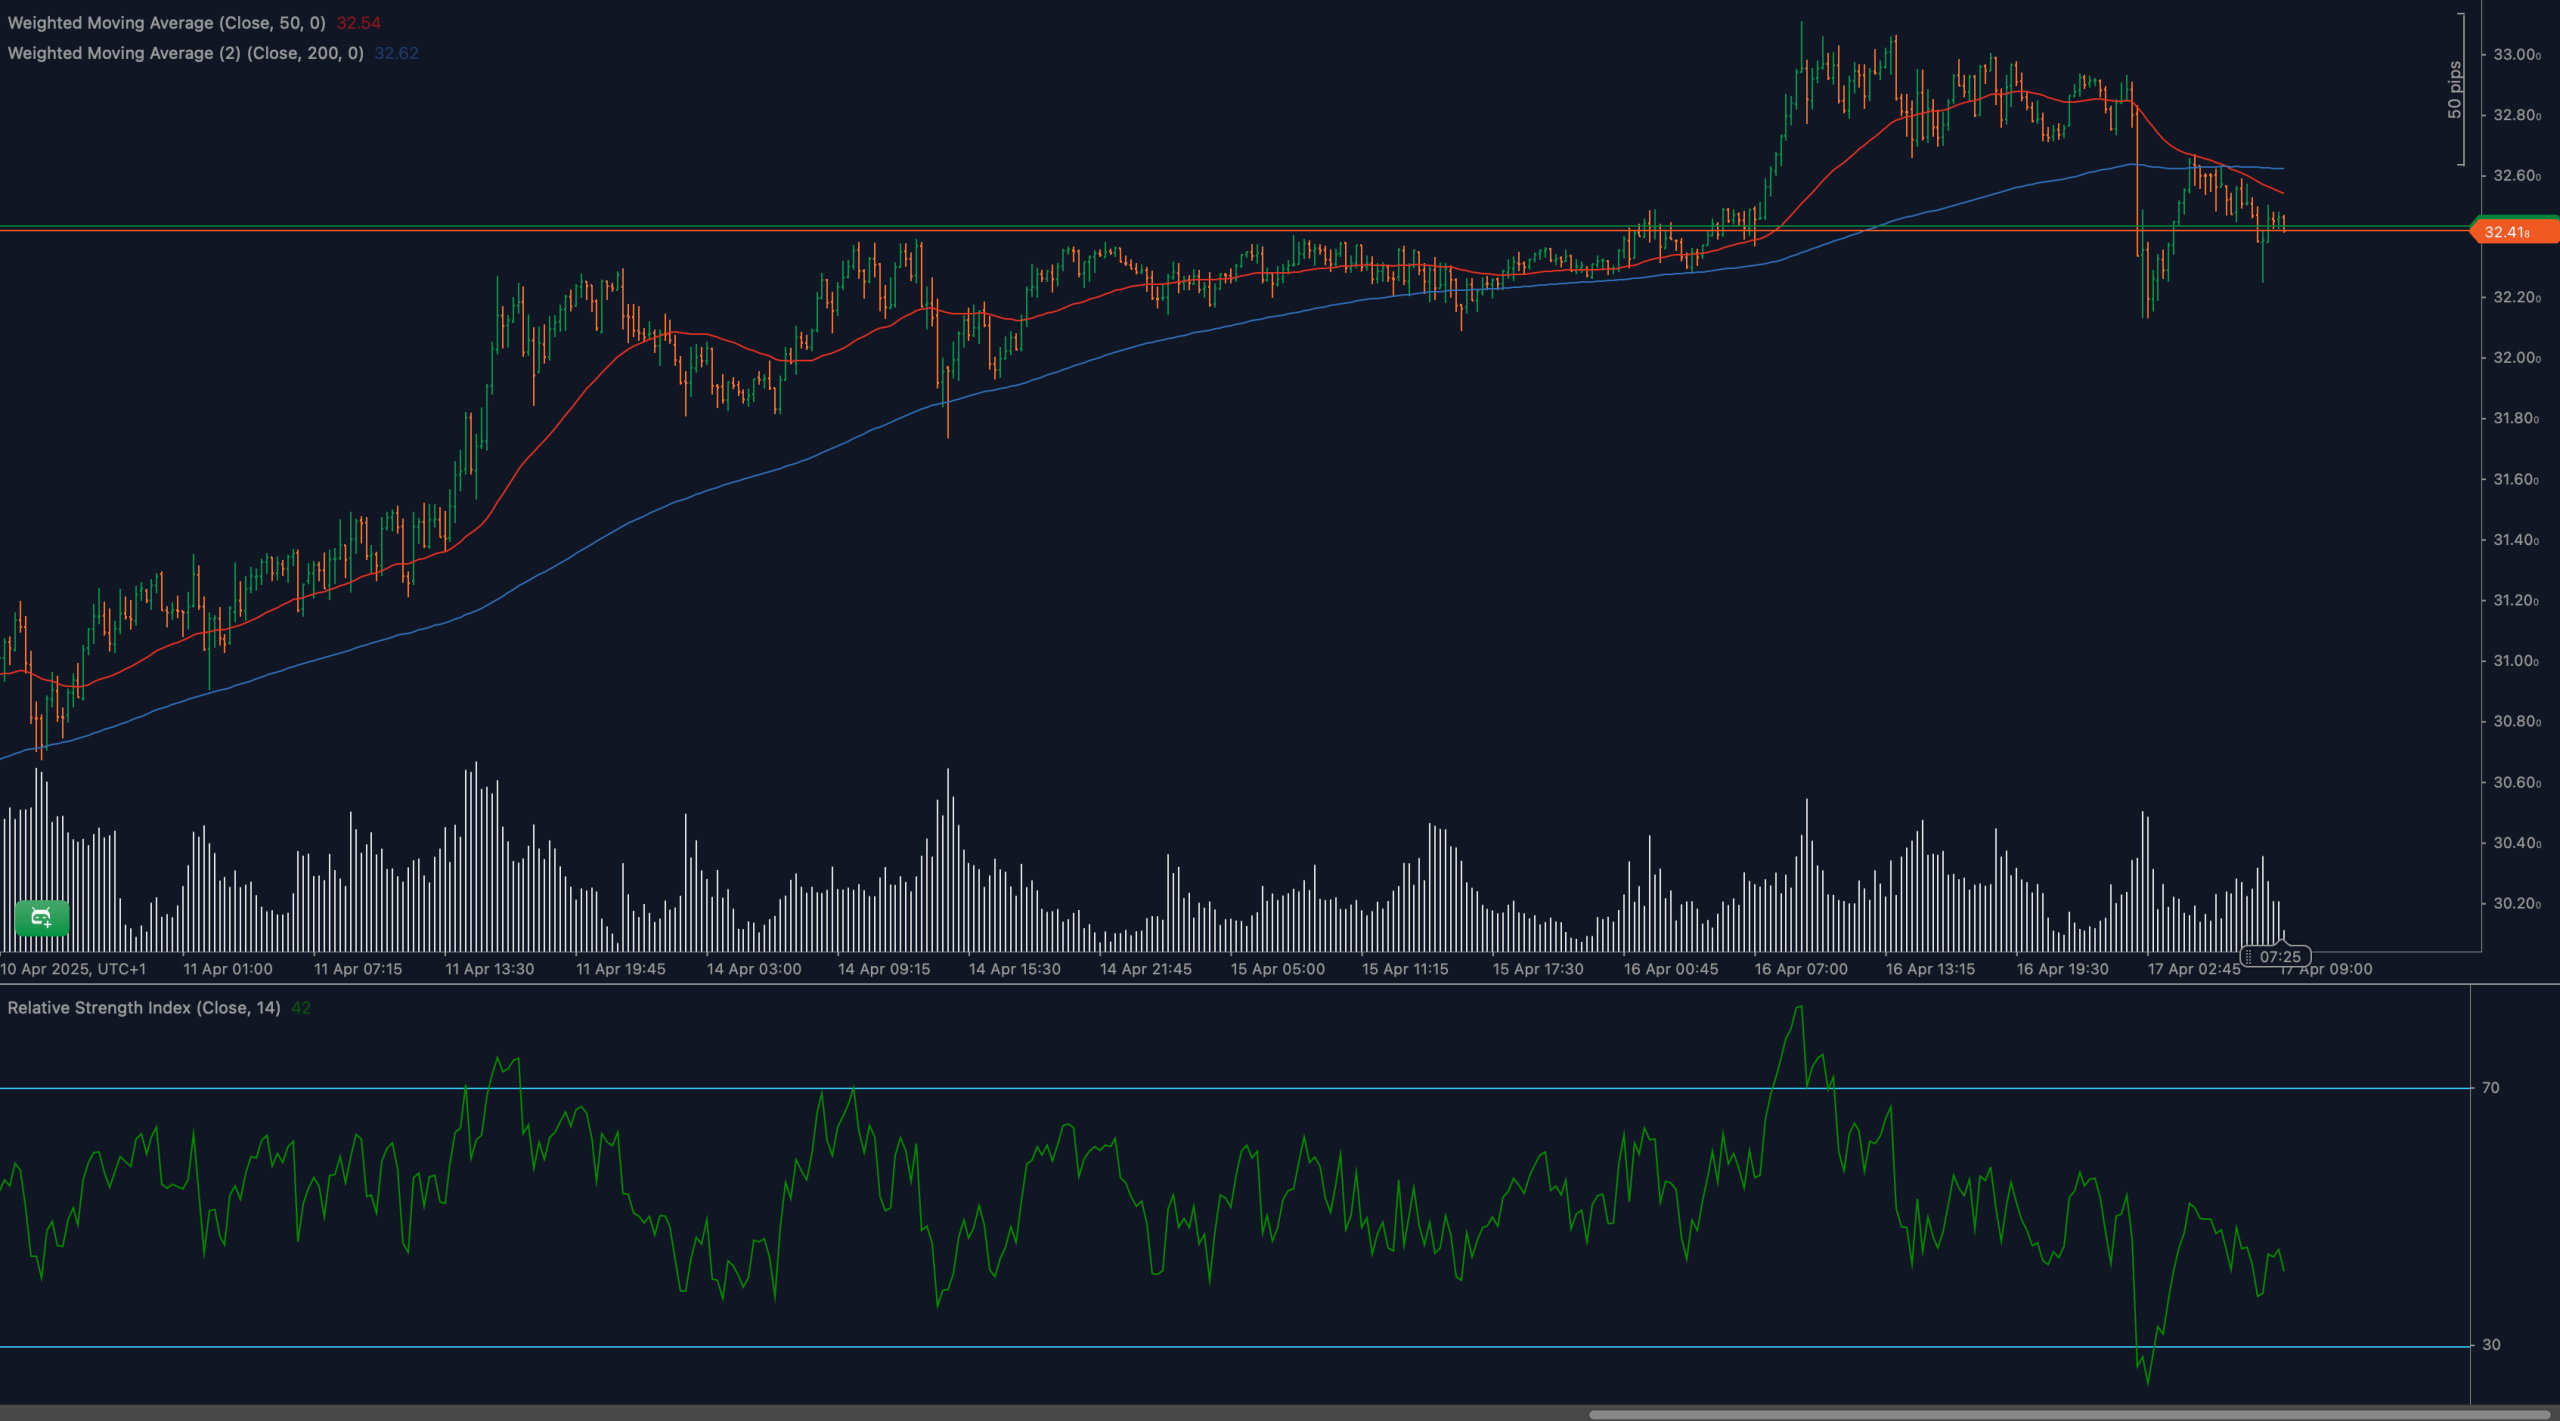
XAG/USD (Silver) has turned sharply lower after peaking near the $33.00 area, now breaking decisively below the key support level at $32.40. This shift marks a change in tone for the market, which had been bullish throughout early April. With both short- and long-term moving averages beginning to roll over and RSI pressing into bearish territory, downside pressure is building.
Silver has also lost the technical structure of higher lows, and the latest attempt to reclaim $32.40 was rejected. Unless bulls can reclaim this level quickly, the risk of deeper correction increases. Volume remains active but is no longer supporting aggressive buying, indicating potential trend fatigue.
📈 TECHNICAL ANALYSIS
What Are the Key Support and Resistance Levels for XAG/USD?
Immediate resistance is now at $32.40, the broken support level which is likely to act as new resistance. A clean break back above this line could invalidate the bearish outlook. Higher resistance is at $32.80 and $33.00. To the downside, the next supports lie at $32.00, followed by a stronger zone at $31.60 — the latter aligning with prior consolidation structure.
Moving Average Analysis and Dynamic Price Levels
Silver is now trading below both the 50-period WMA ($32.54) and the 200-period WMA ($32.52). This cross-down from above signals increased bearish pressure. Both moving averages have flattened or begun turning lower, removing short-term trend support. These dynamic levels are now stacked as overhead resistance and need to be cleared to resume a bullish structure.
RSI Momentum Analysis and Divergence Patterns
The 14-period RSI has dropped to 42, following a failed overbought test above 70 earlier this week. This transition signals waning bullish momentum and a potential shift toward bearish dominance. There are no divergence patterns currently, but RSI continues to hover below 50 — a bearish bias unless reversed soon.
Price Action and Candlestick Analysis
Price action near $32.40 has shifted from tight range-bound consolidation to sharper rejection candles. Bearish engulfing formations and long upper wicks formed during retests of $32.50 underscore the market’s unwillingness to move higher. The latest candles show shallow rebounds and weak follow-through — classic signs of a market under pressure.
Chart Patterns and Formation Analysis
There are early signs of a rounded top forming near $33.00, followed by a descending channel setup. The failure to sustain higher highs and the breakdown below $32.40 confirms the bearish structure. If price forms lower highs beneath that level, this channel may guide a broader pullback toward $32.00 or below.
Fibonacci Retracement Levels and Extension Targets
Using the April 10 swing low near $31.20 and the April 15 high near $33.00, the 38.2% Fibonacci retracement lands at $32.30 — now broken. The 50% level lies near $32.10, and the 61.8% near $31.90. If price continues lower, extension targets include $31.60 (127.2%) and $31.20 (161.8%).
🔍 MARKET OUTLOOK & TRADING SCENARIOS
Bullish Scenario for XAG/USD
To shift bullish again, Silver would need to reclaim $32.40 and break above both WMAs with strength. RSI must climb above 50, and price should close convincingly over $32.60 to invalidate the bearish setup. This would reopen targets at $32.80 and $33.00.
Neutral Scenario for XAG/USD
If price remains trapped between $32.00 and $32.40, a short-term consolidation may occur. This scenario could produce choppy action, with RSI hovering near 50 and traders awaiting a breakout. It may favor scalping or intraday setups rather than directional trades.
Bearish Scenario for XAG/USD
A confirmed rejection at $32.40 and continued weakness would support further downside. A break below $32.00 opens space toward $31.60, especially if RSI slips under 40. Bearish confirmation would strengthen if price remains beneath both moving averages and volume increases on the sell-side.
💼 TRADING CONSIDERATIONS
For bearish setups, traders could look for short entries beneath $32.40, with stops just above $32.60 and targets at $32.00, $31.80, and $31.60. Bearish continuation setups are favored if the RSI trends lower and moving averages reject further attempts to reclaim former support.
Bullish reversal trades should only be considered on confirmed reclaim of $32.40 with volume and RSI recovery. Entries could be placed above $32.60, targeting $32.80 and $33.00, with stops below $32.30. Until then, risk remains skewed to the downside.
🏁 CONCLUSION
Silver (XAG/USD) has broken below a key structural level at $32.40, now facing resistance from both price and dynamic indicators. RSI weakness, bearish candles, and moving average pressure all align to suggest a possible short-term correction is underway. Traders should focus on confirmation candles and volume spikes to validate their setups, especially around the $32.00 zone.
⚠️ DISCLAIMER
This analysis is provided for informational purposes only and does not constitute trading or investment advice. Trading in leveraged instruments involves significant risk and may not be suitable for all investors. Always consult with a licensed financial advisor before making trading decisions.


